| Competence.area | Competence | Common.label | ICILS.Label | PISA.Label | Type.of.DSE |
|---|---|---|---|---|---|
| 1. Information and data literacy | 1.1 Navigate, search and filter data, information | Search information | Search for relevant information for a school project on the internet | Search for and find relevant information online | General |
| 1. Information and data literacy | 1.1 Navigate, search and filter data, information | Source information | Find the original sources of information referred to in an article on the internet | General | |
| 1. Information and data literacy | 1.2 Evaluate data, information and digital content | Evaluate information | Judge whether you can trust information you find on the internet | Assess the quality of information you found online | General |
| 1. Information and data literacy | 1.3 Manage data, information and digital content | Collect data | Collect and record data (e.g., using data loggers, Google Forms, spreadsheets) | General | |
| 1. Information and data literacy | 1.3 Manage data, information and digital content | Install app | Install a program or app | General | |
| 1. Information and data literacy | 1.3 Manage data, information and digital content | Change settings | Change the settings on a device to suit your needs and preferences | General | |
| 2. Communication and collaboration | 2.1 Interact through digital technologies/2.2 Share info | Explain content | Explain to other students how to share digital content online or on a school platform | General | |
| 2. Communication and collaboration | 2.1 Interact through digital technologies/2.2 Share info | Share content | Upload text, images, or video to an online profile | Share practical information with a group of students | General |
| 2. Communication and collaboration | 2.4 Collaborate through digital technologies | Pair collaboration | Collaborate with other students on a group assignment | General | |
| 3. Digital content creation | 3.1 Develop digital content | Write text | Write or edit text for a school assignment | Write or edit text for a school assignment | General |
| 3. Digital content creation | 3.1 Develop digital content / 3.2 Integrate content | Create media | Create a multi-media presentation (with sound, pictures, or video) | Create a multi-media presentation (with sound, pictures, or video) | General |
| 3. Digital content creation | 3.1 Develop digital content / 3.2 Integrate content | Insert image | Insert an image into a document or message | General | |
| 3. Digital content creation | 3.2 Integrate and re-elaborate digital content | Edit image | Edit digital photographs or other graphic images | General | |
| 3. Digital content creation | 3.1 Develop digital content | Develop webpage | Build or edit a webpage | Create, update and maintain a webpage or a blog | Specialized |
| 3. Digital content creation | 3.4 Programming | Programming | Use a text-based programming language (e.g., Python, JavaScript...) | Create a computer program (e.g., in Scratch, Python, Java) | Specialized |
| 3. Digital content creation | 3.4 Programming | Visual coding | Use visual coding (e.g., Scratch, Lego Mindstorms) to develop a simple computer program | Specialized | |
| 4. Safety | 4.1 Protect devices/ 4.2 Protect personal data and privacy | Privacy settings | Change the settings of a device or App in order to protect my data and privacy | General | |
| 5. Problem solving | 5.1 Solve technical problems | Identify error | Identify the source of an error in a software after considering a list of potential causes | Specialized | |
| 5. Problem solving | 5.2 Identify needs and technological responses | Identify app | Select the most efficient programme or App that allows me to carry out a specific task | Specialized | |
| 5. Problem solving | 5.3 Use digital technologies creatively | Logical solution | Break down a problem and represent a solution as a series of logical steps, such as an algorithm | Specialized |
Measuring Digital Self-Efficacy in International Large-Scale Assessments: A bi-dimensional comparative scale Between ICILS and PISA
Daniel Miranda1, Ismael Aguayo2, Nicolás Tobar3, Tomás Urzúa4 and Juan Carlos Castillo[^jc]
Abstract
Understanding students’ beliefs about their capabilities with digital technologies, commonly referred to as digital self-efficacy (DSE), is critical for interpreting cross-national assessments of digital competence. International large-scale assessments differ in how DSE is measured. The International Computer and Information Literacy Study (ICILS) adopts a bidimensional approach, while the Programme for International Student Assessment (PISA) treats DSE as a unidimensional construct, despite relying on highly similar digital tasks. This study examines whether a bidimensional structure of DSE can be empirically supported in both assessments across diverse educational systems. Within a structural equation modeling framework, we employ multi-group confirmatory factor analysis to assess the validity and comparability of specialized and general dimensions of DSE across countries and genders. The results support a two-factor structure in both datasets, full gender invariance, and scalar invariance achieved by only one assessment. A descriptive exploration shows, consistently across countries and studies, smaller gender differences in general DSE, while specialized DSE systematically favors boys. These findings refine the interpretation of DSE in international assessments and emphasize the importance of construct dimensionality, as well as the need to update measurement instruments to account for rapid technological innovation.
1 Introduction
Digital competence has become essential for learning and participation in contemporary societies, yet research increasingly shows that mastering digital technologies requires more than access to devices or procedural knowledge: it also involves attitudinal dispositions such as confidence, persistence, and adaptability in complex digital environments (Dijk, 2020; European Commission Joint Research Centre, 2022; Lythreatis et al., 2022). Digital self-efficacy (DSE), defined as the belief in one’s ability to accomplish tasks and overcome obstacles in digital contexts, has therefore emerged as a central construct for understanding the development of digital competences (Bandura, 1995; Ulfert-Blank & Schmidt, 2022). Compared with purely skill-based measures, DSE captures perceived capability in ways that help explain why some learners navigate digital transformations successfully while others struggle(Rohatgi et al., 2016; Scherer & Siddiq, 2015).
A growing body of cross-national research has examined how DSE levels and inequalities vary across countries, typically attributing these differences to broader sociocultural and educational contexts (Campos & Scherer, 2024; Hatlevik et al., 2018). Yet, despite the prominence of these descriptive comparisons, less attention has been devoted to the measurement comparability of DSE across populations, which may limit the interpretability of cross-national differences and the robustness of claims about differences. Without tests of comparability, it is difficult to determine whether observed differences reflect substantive disparities or methodological artifacts (Leitgöb et al., 2023).
International large-scale assessments (ILSAs) offer a unique opportunity to address the issues of comparability, although existing instruments are not fully aligned. For instance, the International Computer and Information Literacy Study (ICILS) distinguish between general and specialized DSE using a bidimensional framework(Fraillon, 2025), whereas the Programme for International Student Assessment (PISA) has traditionally adopted a unidimensional approach by aggregating digital self-confidence into a single scale(OECD, 2023). These differences are consequential: when closely related constructs are operationalized differently across assessments, cross-study comparisons become difficult and the cumulative evidence on the social determinants of digital competence remains fragmented.
Additionally, gender differences in DSE represent one of the most salient focus in most of the educational systems. Historically, women have reported lower levels of confidence and motivation in digital environments, especially in domains associated with STEM or advanced technical applications (Cai et al., 2017; Hargittai & Shafer, 2006). More recent evidence suggests a more nuanced pattern: while women often report lower self-efficacy in specialized domains such as programming or data analysis, they may equal or outperform men in basic digital tasks related to information navigation, communication, and content creation (Gebhardt et al., 2019). However, the magnitude of these gender differences varies across countries (Campos & Scherer, 2023), suggesting that both context and measurement play an important role.
This study examines whether a two-dimensional structure of DSE, general and specialized, can be identified and compared across ICILS and PISA. Specifically, we (i) test the fit of a bidimensional DSE model in both assessments, (ii) evaluate measurement invariance across gender and countries, and (iii) examine cross-national variation in gender differences in DSE in each study.
2 Self-efficacy and Digital Technologies
2.0.1 Self-efficacy and digital learning
Self-efficacy, originally formulated by Bandura (1982), refers to individuals' judgments about their capability to execute actions required to manage prospective situations (p. 122). This construct is central to human agency because it helps explain how people approach challenges, sustain effort despite setbacks, and build competence in complex domains. Self-efficacy beliefs support goal setting, persistence, and the interpretation of performance feedback, thereby shaping learning and achievement across a wide range of contexts (Bandura, 1995; Bandura, 1997; Steele & Aronson, 1995).
Self-efficacy is particularly relevant for understanding learning processes involving digital technologies (Aesaert et al., 2017; Hatlevik et al., 2015; Moos & Azevedo, 2009). A substantial research agenda has examined how self-efficacy beliefs relate to the adoption of new technologies and the development of digital competence, yet measurement approaches remain fragmented. Early work focused on general computer self-efficacy and confidence in specific software applications (Compeau & Higgins, 1995; Durndell & Haag, 2002; Moos & Azevedo, 2009; Weigel & Hazen, 2014), whereas other strands emphasized self-efficacy for internet navigation and online communication (Eastin & LaRose, 2000; Hsu & Chiu, 2004; Liang & Tsai, 2008). This diversity of operationalizations highlights an ongoing challenge: self-efficacy in digital environments is theoretically meaningful but empirically sensitive to how digital tasks are defined and grouped.
2.0.2 From ICT self-efficacy to Digital Self-Efficacy (DSE)
As digital technologies became increasingly hybrid, combining computational components with networked social interaction, research converged around broader constructs such as ICT self-efficacy, which integrated internet-based tasks with more technical and computer-related activities within a single line of inquiry (Aesaert & van Braak, 2014; Papastergiou, 2010). Within this tradition, several studies adopted a bidimensional approach that distinguishes between (a) general digital tasks related to information processing, communication, and content creation and (b) more advanced or specialized computational tasks such as programming or web development (Aesaert & van Braak, 2014; Hatlevik et al., 2018; Rohatgi et al., 2016). Studies adopting this framework consistently identified contrasting associations with key variables related to competence development: while self-efficacy in general digital tasks tended to align positively with broader digital proficiency, whereas self-efficacy in specialized domains often showed weaker, null or even reverse patterns of relationship (Aydin, 2022; Gebhardt et al., 2019; Rohatgi et al., 2016).
More recently, Ulfert-Blank & Schmidt (2022) argued that traditional ICT self-efficacy instruments may struggle to keep pace with rapid technological change. Because many measures are tied to specific applications, interfaces, or devices, they can become outdated as digital systems evolve. In response, Ulfert-Blank & Schmidt (2022) proposed the construct of Digital Self-Efficacy (DSE), defined as individuals' confidence in their ability to organize and execute actions required to successfully perform digital tasks across diverse and changing contexts. This conceptualization draws on the European Digital Competence Framework (DigComp) (European Commission Joint Research Centre, 2022), emphasizing that self-efficacy measures in digital environments should remain coherent across a broad range of tasks and technological ecologies. We addopt the label of digital self-efficacy rather ICT self-efficacy to highlight that the target of the construct is not a specific set of devices or applications.
2.1 Operationalizations of DSE in international large-scale assessments
A major motivation for this study is that large-scale assessments operationalize DSE in ways that differ substantially in content and dimensionality. Such differences can affect how cross-national inequalities are interpreted and whether findings accumulate meaningfully across studies. Two prominent international large-scale assessments are ICILS and PISA, both of which include student-reported measures related to digital self-efficacy.
2.1.1 ICILS and the bidimensional approach to DSE
The International Computer and Information Literacy Study (ICILS), conducted by the International Association for the Evaluation of Educational Achievement (IEA), is the primary large-scale assessment that adopt and maintains a bidimensional approach to ICT self-efficacy. ICILS assesses students’ Computer and Information Literacy (CIL) through standardized performance tests while also collecting survey data on digital-related attitudes and background variables. The study has been administered three times (2013, 2018, and 2023), using nationally representative samples of eighth-grade students across multiple educational systems.
ICILS draws on Bandura's conceptualization of self-efficacy as perceived capability to execute courses of action (Bandura, 1993) and applies it to students' confidence in performing ICT-related tasks (Fraillon & Rožman, 2025). Since its inception, ICILS has distinguished between (a) self-efficacy in general ICT tasks, confidence in everyday digital activities such as information retrieval, online communication, and content creation, and (b) self-efficacy in specialized ICT tasks, confidence in more technically advanced activities such as programming or database management (Fraillon & Rožman, 2025). This distinction reflects the idea that confidence in routine digital engagement may functions differently from the high-level technical creation.
Although the bidimensional structure has remained stable, the composition and wording of item batteries has evolved across cycles to mirror the changing digital landscape. Between 2013 and 2018, the terminology shifted from “basic” and “advanced” to “general” and “specialized” and recalibrated items accordingly. The 2023 cycle introduced more substantial modifications: specialized dimension was narrowed to focus strongly on visual coding, text-based programming and web creation, moving away from earlier items related to local networks or database management, while the general dimension incorporated updated items reflecting contemporary information literacy demands (e.g., idenfiying original sources). Item stems were also revised to reduce explicit references to "computers", acknowledging the diversity of devices used by students.
Psychometric validation of the bidimensional ICILS self-efficacy framework has been consistently documented across cycles, although the methodological strategies have evolved. In the 2013 and 2018 cycles, dimensionality was examined using exploratory procedures in field trials and later confirmed through Confirmatory Factor Analysis (CFA) within a Structural Equation Modeling (SEM) framework (Fraillon et al., 2015). The 2018 cycle extended this approach by using multi-group CFA to evaluate measurement invariance across educational systems (Fraillon et al., 2020a). In the 2023 cycle, validation shifted toward an Item Response Theory (IRT) framework, using Partial Credit Models (PCM) and multi-group PCM to assess fit and cross-national comparability (Fraillon et al., 2025). Taken together, evidence from ICILS supports the operationalization of digital self-efficacy as two related but distinct dimensions.
The empirical distinctiveness of the bidimensional framework is reinforced by the diverging relationships that general and specialized self-efficacy exhibit with digital competence and gender across diverse educational systems. Consistent analyses from ICILS international reports and various independent studies demonstrate that self-efficacy in general ICT tasks functions as a robust, positive predictor of CIL achievement (Aydin, 2022; Fraillon et al., 2020b; Rohatgi et al., 2016; Rožman et al., 2025). Conversely, self-efficacy in specialized tasks has repeatedly shown a null or even negative association with CIL performance. This discrepancy is often attributed to a “misalignment” between the high-level technical skills that specialized ICT self-efficacy encompasses (e.g., programming) and the information-management focus of CIL assessments, where technical expertise does not necessarily translate into informational competence (Fraillon et al., 2019; Rohatgi et al., 2016). Furthermore, this distinction unveils critical gender dynamics: while boys consistently report higher specialized self-efficacy, this gap disappears in the general dimension (Gebhardt et al., 2019), even though girls outperform them in CIL scores across almost all educational systems (Kennedy et al., 2025).
2.1.2 PISA and the unidimensional approach to DSE
The Programme for International Student Assessment (PISA), coordinated by the OECD, evaluates 15-year-old students' ability to apply knowledge and skills in reading, mathematics, and science to real-life challenges (“What Is PISA?” 2023). Since its first cycle in 2000, PISA has expanded its contextual questionnaires and frameworks to capture students' exposure to and engagement with digital technologies. The latest published cycle (PISA 2022) includes measures related to ICT use, access, and digital competence (OECD, 2023).
In PISA, self-efficacy related to digital tasks functions as an important indicator of students' perceived capacity to perform digital activities, particularly given the absence of an ICT performance assessment comparable to ICILS. PISA's framework aligns with DigComp by covering multiple competence areas (information, communication, content creation, safety, and problem solving) (European Commission Joint Research Centre, 2022; OECD, 2023). Consequently, the PISA DSE battery includes items that extend beyond the ICILS operationalization, incorporating tasks such as protecting data privacy or representing computational solutions as algorithms.
Despite overlap in item scope and wording, as can be observed on Table 1, PISA differs from ICILS in its treatment of dimensionality. PISA operationalized digital self-efficacy as a unidimensional construct, treating variation across heterogeneous tasks as reflecting a single latent continuum rather than distinct underlying dimensions (OECD, 2019, 2023). PISA's psychometric validation relies primarily on IRT scaling—often using Partial Credit Models—supported by exploratory analyses (e.g., principal component analyses) used to justify the unidimensional structure (OECD, 2024). Scale quality is evaluated using item-fit indices, category functioning, reliability indicators, and multi-group IRT procedures to support cross-national comparability (Adams et al., 2012; OECD, 2024).
However, unlike ICILS, PISA has not systematically tested multidimensional alternatives for digital self-efficacy, nor has it explicitly examined whether item groupings comparable to ICILS' general and specialized domains form empirically distinguishable latent factors. As a result, although PISA's DSE scale may demonstrate strong psychometric properties under a unidimensional specification, the question of whether students' digital self-efficacy is more accurately represented by a bidimensional structure remains open and requires explicit empirical assessment.
2.1.3 Implications for cross-national and gender research
The unidimensional operationalization of DSE has substantive consequences for how digital inequality is described and interpreted. Studies using PISA ICT self-efficacy battery as a single latent construct consistently report significant associations with gender, socioeconomic status, ICT use, motivational orientations toward technology, and academic achievement across reading, mathematics, and science (Chen & Hu, 2020; Hori & Fujii, 2021; Kunina-Habenicht & Goldhammer, 2020; Yu & Hu, 2022). These findings suggest that digital self-efficacy, as measured in PISA, functions as a meaningful predictor of educational outcomes (Yu & Hu, 2022). At the same time, collapsing heterogeneous digital tasks into a single continuum implies functional equivalence between qualitatively different forms of digital engagement, ranging from routine information and communication tasks to more specialized and computationally demanding activities (OECD, 2023).
Emerging evidence suggests that the heterogeneity of digital task may matter. while self-efficacy related to general or information-oriented digital skills tends to show robust positive associations with achievement and background variables, self-efficacy related to more specialized or computational domains often displays weaker, null, or reverse relationships (Hristov et al., 2026; Tømte & Hatlevik, 2011). Yet, despite these recurrent patterns, these dimensional splits have rarely been subjected to formal tests of construct validity or cross-national measurement invariance, which limits confidence in substantive interpretations about gender inequalities or between-country differences.
When comparing psychological or educational constructs across social groups or countries, the issue of measurement invariance is a critical methodological requirement. Without evidence that scale functioning similarly across populations, differences in latent means or associations may reflect measurement artifacts rather than genuine disparities (Davidov et al., 2014; Leitgöb et al., 2023). This concern is particularly relevant for DSE, as cross-national variation in digital experiences, institutional exposure to ICT, and cultural expectations may shape how students interpret and respond to self-efficacy items (Gebauer et al., 2021; Hatlevik et al., 2018; Senkbeil, 2022). Educational systems may attach different meanings to similar technology-related tasks due to differences in curricula, infrastructure, and the social valuation of technological skills (Annemann et al., 2025; Conte et al., 2025; Martín-Párraga et al., 2023).
While the two-dimensional structure proposed by ICILS has been widely used and supported in cross-national research (Campos & Scherer, 2024; Gebhardt et al., 2019; Karpiński et al., 2023; Rohatgi et al., 2016), and some studies have applied similar item groupings to PISA (Hristov et al., 2026; Tømte & Hatlevik, 2011), no study has systematically examined whether a comparable bidimensional DSE construct can be established and validated across both assessments. In addition, although partial cross-national invariance has been tested for the ICILS DSE scales (Campos & Scherer, 2024; Fraillon et al., 2025) and gender invariance has been explored for bidimensional DSE specifications in PISA [Hristov et al. (2026)], cross-assessment comparability remains largely unaddressed.
Considering the previous framework, we test the following hypotheses:
\(H_{1}\): It A two-dimensional model of digital self-efficacy (general and specialized) can be identified in both PISA 2022 and ICILS 2023.
\(H_{2}\): The two-dimensional measurement model of digital self-efficacy is invariant across countries.
\(H_{3}\): The two-dimensional measurement model of digital self-efficacy is invariant between girls and boys.
\(H_{4}\): Gender differences in DSE are dimension-specific: boys report higher levels of specialized DSE than girls, whereas gender differences in general DSE are smaller or absent.
3 Methods
3.1 Data
ICILS 2023 employed a two-stage cluster sampling approach across 34 countries and more than 130,000 studentes around the world. In the first stage, schools with students in the target grade were randomly selected using a probability proportional to size (PPS) method. In the second stage, one intact class was randomly selected within each sampled school, and all students in that class were invited to participate (Fraillon, 2024).
PISA 2022 target population consists of 15-year-old students attending educational establishments, employing a two-stage stratified sampling design. In the first stage, schools were systematically selected with PPS from national sampling frames. In the second stage, a target number of students (typically 42) were randomly selected with equal probability from within each sampled school (OECD, 2024). Official subset of data reach around 393,000 students, nested on 52 countries (maily OECD).
To ensure comparability, both datasets were filtered to include only those countries which participated in PISA ICT questionnaire and the ICILS survey. Furthermore, to maximize the overlap between the samples, specific adjustments were made. In ICILS data, Germany is reported as two separate regions reflecting its distinct educational systems; for this analysis, these regions were aggregated to form a single national entity. Similarly, the ICILS data for Belgium were collected exclusively from the Flemish Community (Flanders) in this wave. To align the datasets, the data from Flanders were treated as representative of the entire country.
The final country-level sample include 22 countries, with 91,132 nested students in ICILS and 183,902 in PISA.
3.2 Variables
Both studies include a module on digital self-efficacy in their questionnaires. In ICILS the 13 items are introduced with the phrase “How well can you do:” and recoded categories are 1 = I do not think I could do this; 2 = I have never done this, but I could work out how to do it; 3 = Moderately well; 4 = Very well. PISA prefaces its 14-item module with the question “To what extent are you able to do the following tasks when using <digital resources>?”, where <digital resources> is a placeholder for a term adapted to the target culture. PISA recoded categories are 1 = I cannot do this; 2 = I struggle to do this on my own; 3 = I can do this with a bit of effort; 4 = I can easily do this. Responses as “I don’t know” was threated as missing values. A complete comparison of the items from both surveys was presented in Table 1, highlighting the concordances and distinctions between the tasks considered on bot studies, the Digcomp area which the task correspond, and the type of DSE we are assuming to match the item.
We also consider the three-digit ISO country code and the student’s sex (recoded as 1 = male and 2 = female) from both datasets.
3.3 Analytical Strategy
The main analyses were performed within a Confirmatory Factor Analysis (CFA) framework to test the hypothesized two-factor structure of DSE (Brown, 2015). The CFA models were estimated with the lavaan package (Rosseel, 2012). Given the ordinal nature of the Likert-scale items, they were treated as ordered categorical variables. Therefore, models were estimated using the Weighted Least Squares Mean and Variance Adjusted (WLSMV) estimator. Missing data were handled using pairwise deletion, which is the standard approach for this estimator in lavaan besides the (default) listwise deletion. In both studies, the complex structure of the samples was addressed using sample weights (Senate Weights5). This weighting was applied to all models and descriptive analyses to ensure representative parameter estimates.
To evaluate the goodness-of-fit of the models, chi-square (χ²) test was used. However, due to the test’s sensitivity to large sample sizes, model evaluation primarily relied on a complementary set of fit indices: the Comparative Fit Index (CFI), the Tucker-Lewis Index (TLI), and the Root Mean Square Error of Approximation (RMSEA). Following common guidelines, CFI and TLI values of .95 or higher are considered indicative of excellent fit, while values between 0.90 and 0.95 are considered acceptable. For RMSEA, values of .06 or less indicate a close fit, while values up to .08 are considered adequate (Brown, 2015; Wang & Wang, 2012). To verify the reliability of the models, McDonald’s \(\omega\) will be reported. Values above .7 indicate good reliability (Hair, 2009). In terms of convergent validity, statistically significant factor loadings of at least .5 will be required. In addition, an Average Variance Extracted (AVE) of at least .5 will be required, which means that the model explains 50% of the variance of the items on average (Cheung et al., 2024). The R semTools package was used to perform reliability and convergent validity analyses (Jorgensen et al., 2025).
The analysis process involved a series of consecutive steps. The first was to estimate a pooled model to evaluate the fit of the hypothetical model in each study. In instances where the initial model failed to achieve an acceptable fit, a principled procedure of model re-specification was undertaken. Sources of model misfit were diagnosed by examining multiple indicators, including residual correlation matrices and modification indices. Items identified as primary sources of misspecification were considered for removal. However, any modification was contingent upon a strong theoretical justification beyond statistical improvement. We critically evaluated items for potential issues related to ambiguous phrasing, conceptual overlap, or compromised content validity due to the evolving technological context. This process was performed judiciously to arrive at a final, well-fitting model that remained theoretically coherent. A factor was required to have a minimum of three indicators to be retained.
In the next step, to test the comparability of this measurement model across countries and genders, a series of Multi-Group Confirmatory Factor Analyses (MGCFA) was conducted to assess Measurement Equivalence or Invariance (ME/I) (e.g., Beaujean, 2014; Davidov et al., 2014). This procedure involves testing three sequential levels of invariance by imposing progressive restrictions: 1) configural invariance, which tests if the same factor structure holds for all groups; 2) metric invariance, which adds the constraint that factor loadings are equal across groups; and 3) scalar invariance, which further constrains item intercepts (or thresholds for ordinal items) to be equal (Cheung & Rensvold, 2002; Milfont & Fischer, 2010). The establishment of invariance between these nested models was evaluated by examining the change in CFI (ΔCFI) and RMSEA (ΔRMSEA). Specifically, for metric (weak) invariance, a change in CFI of ≥ -.004 and a change in RMSEA of ≤ .05 were considered acceptable. For scalar (strong) invariance, a ΔCFI of ≥ -.004 and a ΔRMSEA of ≤ .01 were considered adequate (Rutkowski & Svetina, 2017). Achieving metric invariance is a prerequisite for further analysis of association among dimensions of DSE with factors. Achieving scalar invariance is a prerequisite for further analysis of association among dimensions of DSE with factors and estimation of the latent means across countries and across gender.
Upon establishing scalar invariance, latent mean scores of General and Specialized DSE country distribution are explored. In the next step the magnitude of the DSE gender gap is visualized for each country.
All data management and analyses were conducted using the R statistical environment. The hypotheses were previously pre-registered on Open Science Framework and the code analyses are available on Github.
4 Results
The results are organized into three sequential sections. The first section reports the assessment of the global measurement model and the subsequent invariance testing for the ICILS dataset. The second section presents the equivalent analysis for the PISA dataset, including model specification, fit, and invariance results. Finally, the third section provides the descriptive findings for both studies, focusing on the distribution of scores and gender disparities across the participating education systems.
4.1 Study 1: ICILS
4.1.1 Global Measurement Model Assessment
The initial model for ICILS exhibited a suboptimal fit to the data, with an RMSEA exceeding the acceptable threshold of .08 (\(RMSEA = .088\)). Consequently, the model was respecified based on theory-consistent diagnostics (modification indices and residual correlations). Two items were removed due to evidence of cross-loadings and local dependence to improve parsimony and interpretability. The first problematic item was ‘Find the original sources of information referred to in an article on the internet,’ which displayed a substantial modification index (\(MI = 13,668.28\)) driven by a cross-loading on the Specialized DSE factor. Additionally, this item showed strong positive residual correlations with technical indicators suggesting that students may interpret source verification as a more demanding digital literacy task that overlaps with specialized competencies. We proceeded to remove this item from the General DSE factor; the empirical overlap suggests that the item may tap a broader content-creation component. Subsequently, although the item ‘Build or edit a webpage’ showed a high modification index (\(MI = 4,707.52\)) due to a cross-loading on the General factor, it was retained to preserve model identification and maintain at least three indicators per factor. Instead, we removed the item ‘Create a multi-media presentation (with sound, pictures, or video),’ which exhibited a notable modification index (\(MI = 3,982.96\)) and strong positive residual correlations with ‘Develop webpage.’ The high covariance indicates that students perceive multimedia creation and web development as a unified dimension of ‘content creation’, a finding that aligns with the DigComp framework (‘3.1 Develop Digital Content’). A detailed table presenting all modification indices and residual correlations for the ICILS respecification process is provided in the Appendix (Table 4 and Table 5).
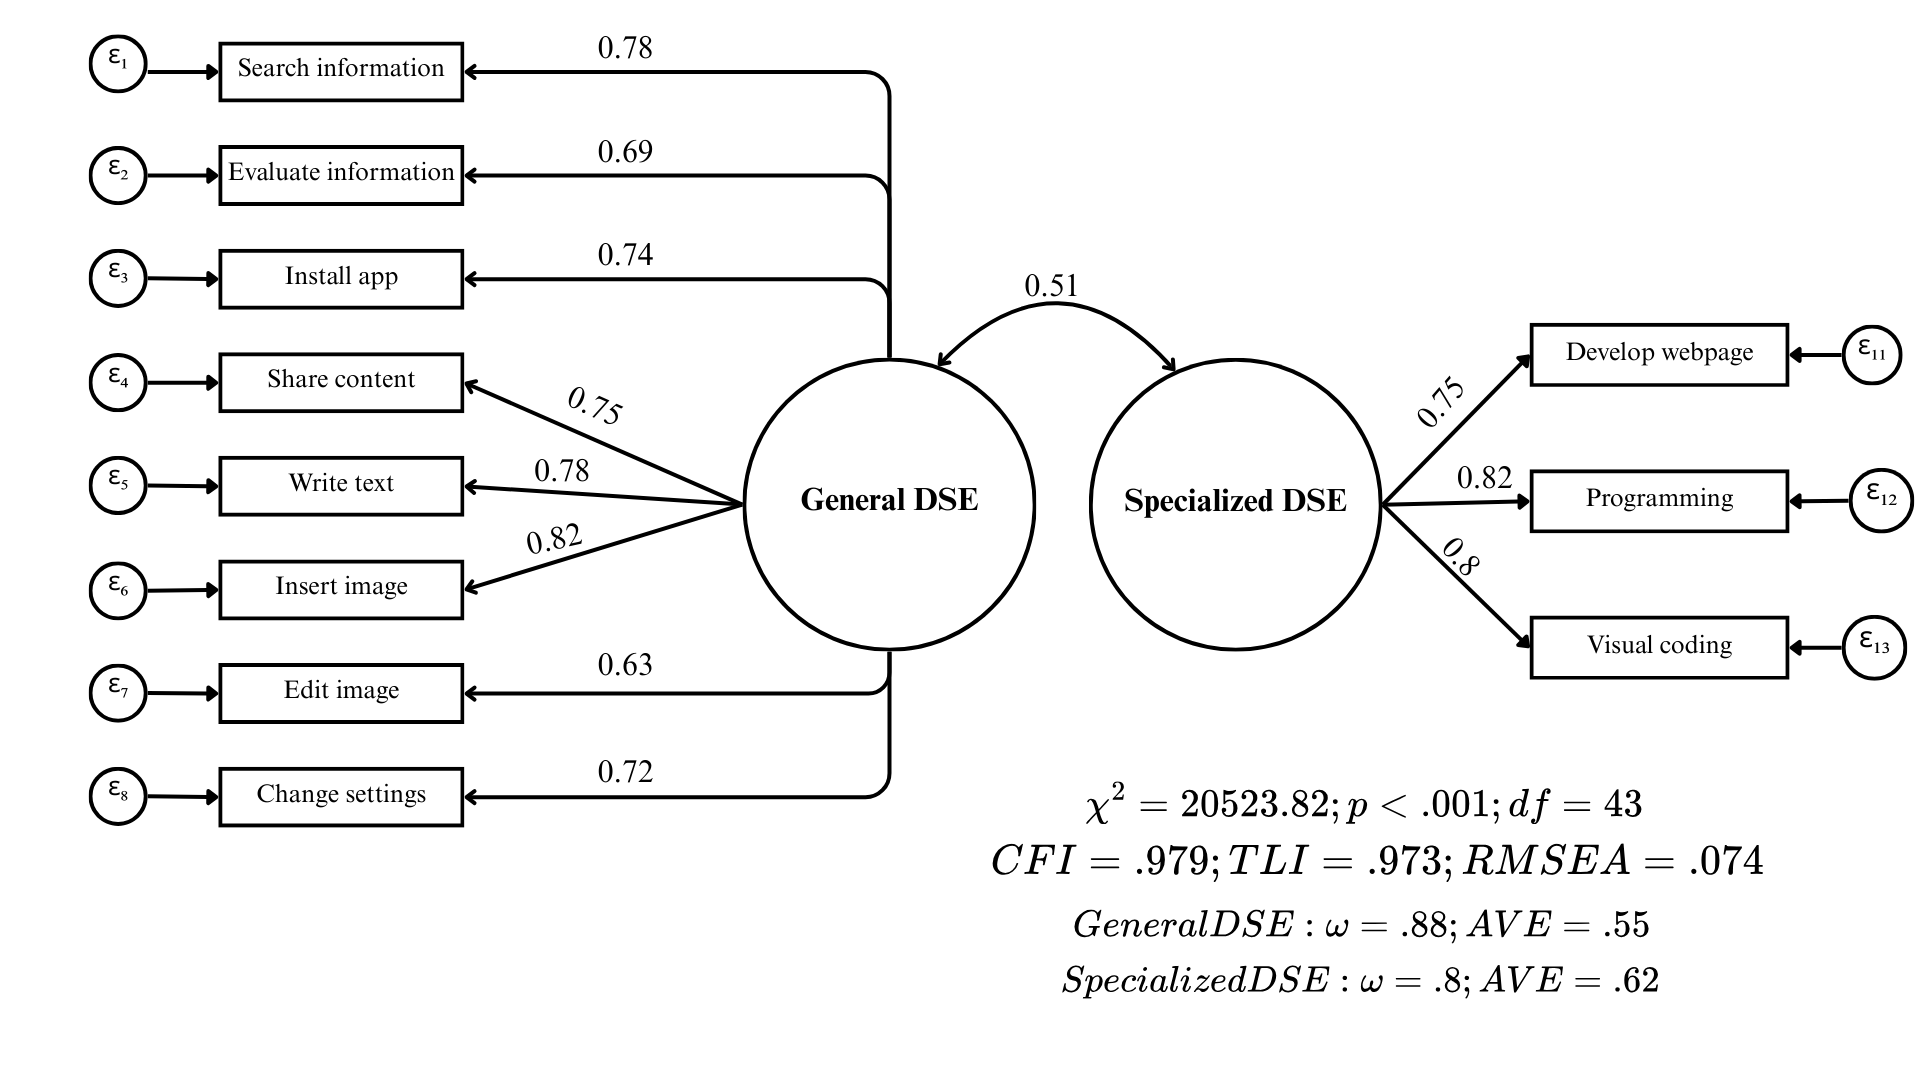
Following the respecification, the final ICILS measurement model yielded fit indices indicative of a good fit to the data (\(\chi^2 = 20,523.816\); \(df=43\); \(p < .001\); \(CFI = .979\); \(TLI = .973\); \(RMSEA = .074\)). Standardized factor loadings were substantial and statistically significant for all indicators, ranging from .63 to .82. This implies that the latent factors account for between 39.5% and 67.6% of the variance in the observed items (\(R^2\)). Regarding psychometric quality, both dimensions exhibited adequate internal consistency and convergent validity, with statistics surpassing the recommended cutoffs (General DSE: \(\omega = .88\), \(AVE = .55\); Specialized DSE: \(\omega = .80\), \(AVE = .62\)). Finally, the estimation revealed a moderate correlation of .51 between the two factors, reinforcing the discriminant validity of the construct.
4.1.2 Measurement Invariance Testing
Type | Model | χ² | df | CFI | TLI | RMSEA | Δχ² | Δdf | ΔCFI | ΔRMSEA | p | Decision |
|---|---|---|---|---|---|---|---|---|---|---|---|---|
Country | 1. Configural | 25,808 | 946 | 0.980 | 0.975 | 0.082 | ||||||
2. Metric | 29,119 | 1,135 | 0.978 | 0.977 | 0.080 | 3,311 | 189 | < -0.004 | < 0.05 | < 0.01 | Yes | |
3. Scalar | 38,640 | 1,555 | 0.971 | 0.977 | 0.079 | 9,521 | 420 | -0.007 | < 0.01 | < 0.01 | No | |
Gender | 1. Configural | 19,559 | 86 | 0.981 | 0.975 | 0.073 | ||||||
2. Metric | 20,092 | 95 | 0.980 | 0.977 | 0.071 | 534 | 9 | < -0.004 | < 0.05 | < 0.01 | Yes | |
3. Scalar | 21,966 | 115 | 0.978 | 0.979 | 0.067 | 1,874 | 20 | < -0.004 | < 0.01 | < 0.01 | Yes |
As presented in Table 2, the ICILS measurement model achieved configural and metric invariance across participating countries. However, scalar invariance could not be established, as the decrease in \(CFI\) (\(\Delta CFI = -.007\)) exceeded the strict cutoff criterion. While establishing metric invariance confirms that the factor loadings are comparable across educational systems, the lack of scalar invariance indicates non-equivalence in item intercepts. In contrast, the assessment of gender invariance yielded positive results; the model satisfied all three levels of invariance (configural, metric, and scalar), with changes in fit indices remaining well within acceptable ranges. Detailed information regarding factor loadings for the General and Specialized DSE dimensions, along with the \(\chi^2\) contribution by country derived from the scalar invariance model, is provided in the Appendix (Table 6) to examine potential sources of misfit across countries.
4.2 Study 2: PISA
4.2.1 Model Respecification and Global Fit
The initial PISA model exhibited substantial misfit (\(RMSEA = .12\)), primarily driven by two items that displayed strong cross-loadings and multiple significant residual covariances. The first item, “Select the most efficient programme or App that allows me to carry out a specific task”, showed a substantial modification index for the General factor (\(MI = 76,502.42\)) and problematic negative residual correlations with items from the Specialized dimension (e.g., “logical solution”, “programming”). Additionally, it showed a positive residual correlation with “Privacy settings”, an indicator of the General DSE factor. Consequently, this item was removed; contrary to the theoretical model, the data suggest this task is perceived by students as a general competency rather than one related to the technical problem-solving nature of the specialized dimension.
The second problematic item was ‘Create, update and maintain a webpage or a blog,’ which also presented a strong cross-loading on the General factor (\(MI = 39,013.99\)). Crucially, it exhibited its strongest positive residual correlation with ‘Create media.’ This specific covariance mirrors the pattern observed in the ICILS respecification, indicating that students perceive web page development and multimedia creation as a unified dimension of ‘content creation,’ a finding aligned with the DigComp framework. Furthermore, unlike ICILS, the PISA item phrasing explicitly references a ‘blog,’ which further anchors the task in non-technical content creation contexts. Based on these consistent empirical and theoretical grounds across both studies, this item was removed from the PISA analysis. In the appendix, a comprehensive table details the modification indices and residual correlations that informed the PISA model respecification process (Table 8 and Table 9).
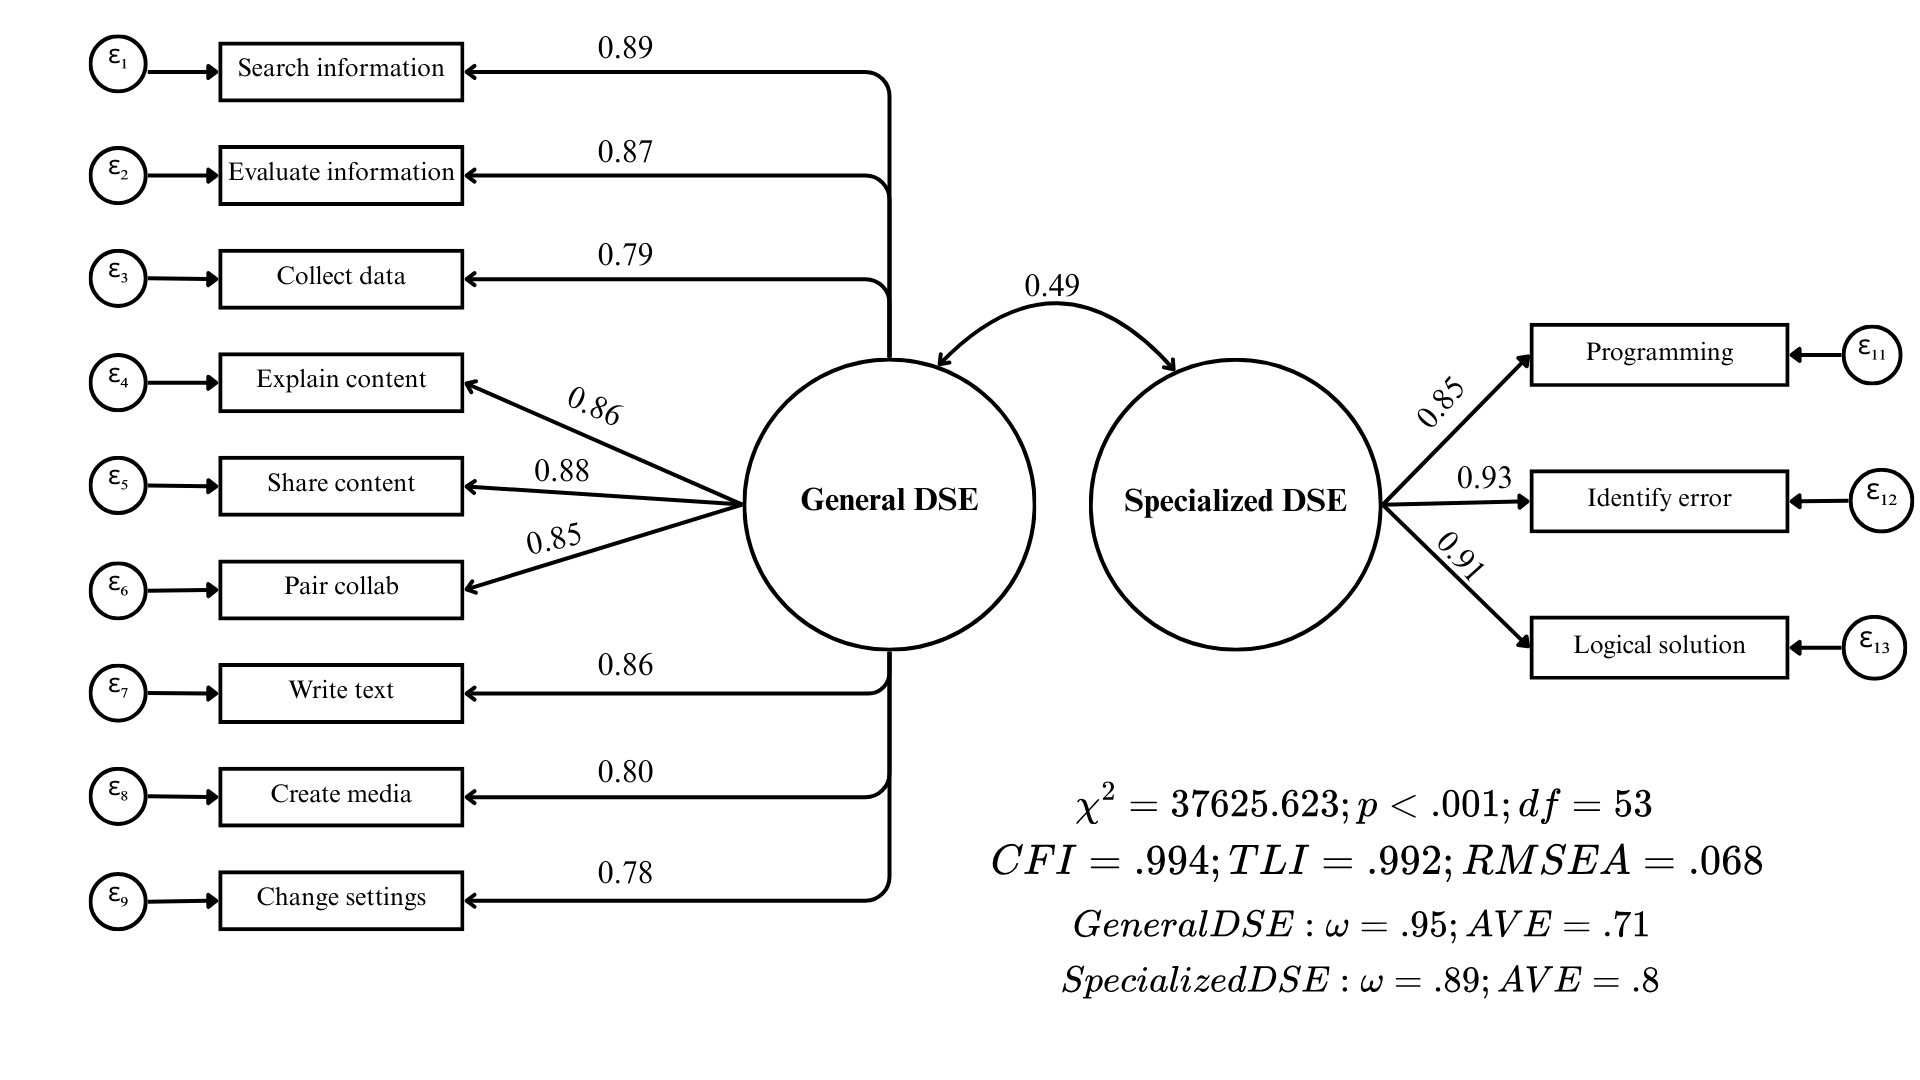
Following this respecification, the PISA model demonstrated a satisfactory fit to the data (\(\chi^2 = 37,625.623\); \(df=53\); \(p < .001\); \(CFI = .994\); \(TLI = .992\); \(RMSEA = .068\)). Factor loadings were high and statistically significant, ranging from .78 to .93, thus explaining between 60% and 86% of the item variance (\(R^2\)). Additionally, both factors demonstrated strong reliability and convergent validity, exceeding all established thresholds (General DSE: \(\omega = .95\), \(AVE = .71\); Specialized DSE: \(\omega = .89\), \(AVE = .80\)). The inter-factor correlation was moderate at .49, further supporting the distinctness of the dimensions.
4.2.2 Measurement Invariance Testing
Type | Model | χ² | df | CFI | TLI | RMSEA | Δχ² | Δdf | ΔCFI | ΔRMSEA | p | Decision |
|---|---|---|---|---|---|---|---|---|---|---|---|---|
Country | 1. Configural | 48,796 | 1,166 | 0.994 | 0.992 | 0.077 | ||||||
2. Metric | 53,756 | 1,376 | 0.993 | 0.993 | 0.074 | 4,960 | 210 | < -0.004 | < 0.05 | < 0.01 | Yes | |
3. Scalar | 55,077 | 1,838 | 0.993 | 0.995 | 0.065 | 1,322 | 462 | < -0.004 | < 0.01 | < 0.01 | Yes | |
Gender | 1. Configural | 37,986 | 106 | 0.994 | 0.992 | 0.069 | ||||||
2. Metric | 39,415 | 116 | 0.994 | 0.993 | 0.067 | 1,429 | 10 | < -0.004 | < 0.05 | < 0.01 | Yes | |
3. Scalar | 39,078 | 138 | 0.994 | 0.994 | 0.061 | -337 | 22 | < -0.004 | < 0.01 | 1.00 | Yes |
As detailed in Table 3, the PISA measurement model successfully established invariance across all three tested levels (configural, metric, and scalar) for both country and gender groupings. The changes in the key fit indices (\(\Delta CFI\) and \(\Delta RMSEA\)) between the nested models remained strictly within the recommended thresholds. These results confirm the cross-cultural and cross-gender comparability of the DSE construct within the PISA dataset, thereby satisfying the necessary psychometric prerequisites for comparative analyses. Consistent with the reporting for ICILS, a detailed table presenting the factor loadings and country-specific \(\chi^2\) contributions derived from the scalar invariance model is provided in the Appendix (Table 10).
4.3 Country and Gender Differences in DSE
This section presents the descriptive analyses by country and gender for both the PISA and ICILS datasets. To ensure that the results accurately reflect the underlying population structures, all descriptive statistics were calculated applying the final sampling weights for each study (Senate Weights). A methodological distinction regarding comparability is necessary: while PISA established scalar invariance (allowing for strict mean comparisons), ICILS only achieved metric invariance. Consequently, the absolute ranking of countries in ICILS should be interpreted with caution and regarded as exploratory. However, we opted to utilize averaged indices for both studies to maintain analytical consistency. A robustness check conducted for both datasets confirmed that the averaged indices and latent mean scores correlated above .95 across all participating countries (see Table 7 and Table 11 in the Appendix). Furthermore, employing averaged indices preserves the original response scale, facilitating the substantive interpretation and enabling a direct comparison between the General and Specialized dimensions across both datasets.


As illustrated in Figure 3 (ICILS) and Figure 4 (PISA), a highly consistent pattern emerges across all participating education systems in both studies: students systematically report higher levels of General DSE compared to Specialized DSE. Regarding the country-level distribution for the Specialized dimension, the results from both assessments reveal a striking counter-intuitive finding. Education systems often characterized by developing digital infrastructure relative to the OECD average report the highest aggregate specialized self-efficacy; this is evident in the prominent position of Kazakhstan and Romania in ICILS, and for Kazakhstan in PISA. In sharp contrast, countries with advanced digital ecosystems and traditionally strong performance on Computer and Information Literacy (CIL) assessments —such as Germany, Austria, and Denmark— rank at the very bottom of the distribution in both studies. This inversion may reflect differences in self evaluative standards, task interpretation, or reference group effects across countries.


Consistent with prior literature (Gebhardt et al., 2019), the analysis reveal distinct gender patterns across the two dimensions of digital self-efficacy, replicated in both assessments. As illustrated in Figure 5 and Figure 6, female students generally report higher levels of self-efficacy in the General dimension; however, these differences are relatively modest in magnitude. In sharp contrast, the Specialized dimension reveals a pronounced and consistent gap favoring male students across almost all participating education systems. Notable exceptions to this trend are observed in countries like Kazakhstan or Chile, where the gender gap in the specialized dimension is minimal. An examination of the country-specific magnitudes reveals a counter-intuitive pattern regarding the relationship between national development contexts and these disparities. Education systems traditionally associated with higher levels of gender equality and digital development, such as Germany, Denmark, and Finland, exhibit considerably larger gender gaps in specialized self-efficacy compared to the aforementioned developing contexts.
5 Discussion
The present study examined whether a bidimensional conceptualization of digital self-efficacy (DSE), distinguishing General and Specialized DSE, can be identified and compared within two major international large-scale assessments, ICILS 2023 and PISA 2022. Overall, the findings support the feasibility of recovering a comparable two-factor structure in both datasets, indicating that students' perceived capability to perform routine digital tasks is empirically distinct from their perceived capability in more specialized or computational activities (supporting \(H_1\)). Although achieving this comparability required targeted model refinement in both studies, the patterns of misfit offer substantive clues about how adolescents interpret and classify digital tasks in contemporary digital environments.
A first contribution of the study concerns measurement validity and model specification. In both ICILS and PISA, a small set of items displayed evidence of cross-loadings and local dependence, suggesting that certain digital tasks do not map neatly onto a purely complexity-based distinction between general versus specialized activities. In particular, tasks involving information, communication, and creation showed consistent empirical overlap, pointing to a different component that may blur boundaries between the two dimensions. For instance, while in previous versions web page development was a clearly distinctive skill of specialized technology users (Fraillon et al., 2015), the results suggest that it shares considerable variance with the latent construct of general self-efficacy now. These results do not contradict the bidimensional structure itself, but highlight that the interpretation of what counts as "specialized" digital engagement may be shifting over time, which has implications for the stability of DSE operationalizations in large-scale assessment.
The observed patterns are consistent with recent findings in the field of digital studies. The diffusion of user-friendly platforms for website building and online publishing reduces the technical barrier for activities that historically required specialized knowledge (Jagtap, 2024; Lively et al., 2023). At the same time, rising standards for sophisticated multimedia production, potentially intensified by social media dynamics and AI-supported content generation, may change the perceived difficulty for tasks previously classified as general digital competence (Alnaser, 2024; Gârdan et al., 2022). These contextual shifts provide a plausible explanation for why some tasks move across the boundary between General and Specialized DSE, underscoring that DSE measurement must remain responsive to technological change.
Our findings also connect to an ongoing conceptual debate regarding the dimensionality of DSE. Recent proposals argue for multidimensional DSE measures aligned with competence frameworks such as DigComp [European Commission Joint Research Centre (2022); Ulfert-Blank & Schmidt (2022)], which organizes digital competence into domains including information and data literacy, communication and collaboration, content creation, safety, and problem solving. Although this approach may provide a theoretically robust alternative to complexity-based distinctions, the available item batteries in ICILS and PISA are currently too short to support a psychometrically stable five-dimensional model, and large-scale validation remains limited. Within these constraints, the present study offers a parsimonious and empirically supported bidimensional solution that is feasible with existing ILSA data and enables systematic comparisons across datasets.
Turning to comparability across groups, invariance results were mixed across assessments. In PISA, the bidimensional model achieved configural, metric, and scalar invariance across countries, providing strong evidence that the construct is comparable across participating education systems (supporting \(H_2\)). In ICILS, the model reached configural and metric invariance but did not meet scalar invariance criteria across countries, suggesting that cross country mean differences should be interpreted cautiously and reinforcing the importance of explicitly evaluating between country comparability before drawing substantive conclusions (partial support for \(H_2\)). These results indicate that even when the same two-dimensional structure is recoverable, the degree of cross national comparability may depend on assessment specific design features and item functioning.
In contrast, gender invariance results were consistently supportive. Both assessments achieved scalar invariance across gender, indicating that General and Specialized DSE can be compared meaningfully between boys and girls within each dataset (supporting \(H_3\)). This finding strengthens the validity of gender comparisons in DSE and suggests that observed gender gaps in DSE are unlikely to be driven by measurement non-equivalence, at least within the tested frameworks.
Beyond measurement evidence, descriptive patterns provided substantive insights into digital inequality. Across countries and in both studies, students reported higher General DSE than Specialized DSE, consistent with the idea that routine digital activities may be more widely internalized than specialized computational competencies. Gender differences were clearly dimensional specific: girls tended to report slightly higher General DSE, whereas boys reported substantially higher Specialized DSE across most education systems. This pattern indicates that gender disparities depend on the type of digital task domain being evaluated (supporting \(H_4\)).
At the country level, the magnitude of gender gaps in Specialized DSE varied considerably across educational systems, and in some contexts the specialized gender gap was minimal. These patterns suggest that the strength of gender differentiation in specialized digital confidence is context dependent rather than universal, supporting \(H_4\) in a cross national comparability. In addition, exploratory country level distributions indicated that high levels of Specialized DSE and smaller specialized gender gaps were not necessarily concentrated in highly digitalized contexts. This counterintuitive pattern aligns with prior evidence that digital self-efficacy may not correspond straightforwardly to objective performance indicators at the country level (Rožman et al., 2025) and with evidence on the gender equality paradox, which suggests that gender gaps in STEM attitudes can be larger in more gender equal settings (Guo et al., 2024; Marsh et al., 2021). Future research should examine whether these results reflect reference group effects, cross cultural differences in calibration, or variation in exposure and social valuation of specialized digital pathways.
This study has three main limitations. First, achieving acceptable model fit required removing a small number of items from the DSE batteries in both assessments, which may reduce content coverage and limits direct comparability with official reporting. Second, cross national invariance in ICILS did not reach the most restrictive level, indicating that country level mean comparisons should be interpreted cautiously. Third, the analyses relied on a single cycle from each assessment (PISA 2022 and ICILS 2023), which prevents evaluating the temporal stability of the measurement models. Future research should extend this approach across cycles to assess whether the two-dimensional structure remains robust as digital environments evolve. In addition, assessment developers may consider expanding and updating DSE item pools to better capture emerging digital competence domains in rapidly changing educational contexts.
6 Conclusions
In sum, the study provides evidence that a two-dimensional representation of DSE is recoverable in both ICILS and PISA (\(H_1\)), that cross-national comparability is stronger in PISA than in ICILS (\(H_2\), partial), that gender comparisons are supported in both assessments (\(H_3\)), and that gender and country differences operate in dimension specific ways (\(H_4\)). These findings highlight the importance of testing measurement assumptions when using ILSA data to interpret digital inequalities and to cumulate evidence across international assessments.
7 References
Adams, R. J., Wu, M., & Wilson, M. (2012). ACER ConQuest version 3: Generalised item response modelling software [Manual]. Australian Council for Educational Research.
Aesaert, K., & van Braak, J. (2014). Exploring factors related to primary school pupils’ ICT self-efficacy: A multilevel approach. Computers in Human Behavior, 41, 327–341. https://doi.org/10.1016/j.chb.2014.10.006
Aesaert, K., Voogt, J., Kuiper, E., & van Braak, J. (2017). Accuracy and bias of ICT self-efficacy: An empirical study into students’ over- and underestimation of their ICT competences. Computers in Human Behavior, 75, 92–102. https://doi.org/10.1016/j.chb.2017.05.010
Alnaser, A. (2024). The Impact of AI-Augmented Image and Video Editing on Social Media Engagement, Perception, and Digital Culture. Journal of Computational Intelligence, Machine Reasoning, and Decision-Making, 9(10), 15–32.
Annemann, C., Menge, C., & Gerick, J. (2025). Teachers’ Participation in Digitalization-Related Professional Development: An International Comparison. Education Sciences, 15(4), 486. https://doi.org/10.3390/educsci15040486
Aydin, M. (2022). A multilevel modeling approach to investigating factors impacting computer and information literacy: ICILS Korea and Finland sample. Education and Information Technologies, 27(2), 1675–1703. https://doi.org/10.1007/s10639-021-10690-1
Bandura, A. (1982). Self-efficacy mechanism in human agency. American Psychologist, 37(2), 122–147. https://doi.org/10.1037/0003-066X.37.2.122
Bandura, A. (1993). Perceived Self-Efficacy in Cognitive Development and Functioning. Educational Psychologist, 28(2), 117–148. https://doi.org/10.1207/s15326985ep2802_3
Bandura, A. (Ed.). (1995). Self-efficacy in changing societies (pp. xv, 334). Cambridge University Press. https://doi.org/10.1017/CBO9780511527692
Bandura, A. (1997). Self-efficacy: The exercise of control (pp. ix, 604). W H Freeman/Times Books/ Henry Holt & Co.
Beaujean, A. A. (2014). Latent Variable Modeling Using R: A Step-by-Step Guide. Routledge. https://doi.org/10.4324/9781315869780
Brown, T. (2015). Confirmatory Factor Analysis for Applied Research: Second Edition. Guildford.
Cai, Z., Fan, X., & Du, J. (2017). Gender and attitudes toward technology use: A meta-analysis. Computers & Education, 105, 1–13. https://doi.org/10.1016/j.compedu.2016.11.003
Campos, D. G., & Scherer, R. (2023). Digital gender gaps in Students’ knowledge, attitudes and skills: An integrative data analysis across 32 Countries. Education and Information Technologies. https://doi.org/10.1007/s10639-023-12272-9
Campos, D. G., & Scherer, R. (2024). Digital gender gaps in Students’ knowledge, attitudes and skills: An integrative data analysis across 32 Countries. Education and Information Technologies, 29(1), 655–693. https://doi.org/10.1007/s10639-023-12272-9
Cheung, G. W., Cooper-Thomas, H. D., Lau, R. S., & Wang, L. C. (2024). Reporting reliability, convergent and discriminant validity with structural equation modeling: A review and best-practice recommendations. Asia Pacific Journal of Management, 41(2), 745–783. https://doi.org/10.1007/s10490-023-09871-y
Cheung, G. W., & Rensvold, R. B. (2002). Evaluating goodness-of-fit indexes for testing measurement invariance. Structural Equation Modeling, 9(2), 233–255. https://doi.org/10.1207/S15328007SEM0902_5
Compeau, D. R., & Higgins, C. A. (1995). Computer Self-Efficacy: Development of a Measure and Initial Test. MIS Quarterly, 19(2), 189–211. https://doi.org/10.2307/249688
Conte, G., Arrigoni, C., Magon, A., De Angeli, G., Paglione, G., Baroni, I., Belloni, S., Ghizzardi, G., Notarnicola, I., Stievano, A., & Caruso, R. (2025). Unlocking the Determinants of Digital and Technological Self-Efficacy: Insights from a Cross-Sectional Study Among Nurses and Nursing Students. Healthcare, 13(17), 2208. https://doi.org/10.3390/healthcare13172208
Davidov, E., Meuleman, B., Cieciuch, J., Schmidt, P., & Billiet, J. (2014). Measurement equivalence in cross-national research. Annual Review of Sociology, 40, 55–75. https://doi.org/10.1146/annurev-soc-071913-043137
Dijk, J. van. (2020). The digital divide. Polity.
Durndell, A., & Haag, Z. (2002). Computer self efficacy, computer anxiety, attitudes towards the Internet and reported experience with the Internet, by gender, in an East European sample. Computers in Human Behavior, 18(5), 521–535. https://doi.org/10.1016/S0747-5632(02)00006-7
Eastin, M. S., & LaRose, R. (2000). Internet Self-Efficacy and the Psychology of the Digital Divide. Journal of Computer-Mediated Communication, 6(1), 0–0. https://doi.org/10.1111/j.1083-6101.2000.tb00110.x
European Commission Joint Research Centre. (2022). DigComp 2.2, The Digital Competence framework for citizens: With new examples of knowledge, skills and attitudes. Publications Office.
Fraillon, J. (Ed.). (2024). An International Perspective on Digital Literacy: Results from ICILS 2023. International Association for the Evaluation of Educational Achievement.
Fraillon, J. (Ed.). (2025). An International Perspective on Digital Literacy: Results from ICILS 2023 (1st ed. 2025). Springer Nature Switzerland. https://doi.org/10.1007/978-3-031-87722-3
Fraillon, J., Ainley, J., Schulz, W., Duckworth, D., & Friedman, T. (2019). IEA International Computer and Information Literacy Study 2018 Assessment Framework. Springer International Publishing. https://doi.org/10.1007/978-3-030-19389-8
Fraillon, J., Ainley, J., Schulz, W., Friedman, T., & Duckworth, D. (2020a). IEA International Computer and Information Literacy Study 2018. Technical Report. International Association for the Evaluation of Educational Achievement.
Fraillon, J., Ainley, J., Schulz, W., Friedman, T., & Duckworth, D. (2020b). Students’ Engagement with Information and Communications Technologies. In J. Fraillon, J. Ainley, W. Schulz, T. Friedman, & D. Duckworth (Eds.), Preparing for Life in a Digital World: IEA International Computer and Information Literacy Study 2018 International Report (pp. 113–173). Springer International Publishing. https://doi.org/10.1007/978-3-030-38781-5_5
Fraillon, J., & Rožman, M. (Eds.). (2025). IEA International Computer and Information Literacy Study 2023: Assessment Framework. Springer Nature Switzerland. https://doi.org/10.1007/978-3-031-61194-0
Fraillon, J., Rožman, M., Meyer, S., Musu, L., Liaw, Y.-L., Christiansen, A., & Tieck, S. (2025). IEA ICILS 2023 Technical Report. International Association for the Evaluation of Educational Achievement.
Fraillon, J., Schulz, W., Friedman, T., Ainley, J., & Gebhardt, E. (2015). ICILS 2013 Technical Report. International Association for the Evaluation of Educational Achievement.
Gârdan, I. P., Mauri, A., Dumitru, I., Gârdan, D. A., Maican, S. S., & Moise, D. (2022). User-Generated Multimedia Content Impact on the Destination Choice: Five Dimensions of Consumer Experience. Electronics, 11(16), 2570. https://doi.org/10.3390/electronics11162570
Gebauer, M. M., McElvany, N., Köller, O., & Schöber, C. (2021). Cross-cultural differences in academic self-efficacy and its sources across socialization contexts. Social Psychology of Education, 24(6), 1407–1432. https://doi.org/10.1007/s11218-021-09658-3
Gebhardt, E., Thomson, S., Ainley, J., & Hillman, K. (2019). Gender Differences in Computer and Information Literacy: An In-depth Analysis of Data from ICILS (Vol. 8). Springer International Publishing. https://doi.org/10.1007/978-3-030-26203-7
Guo, J., Marsh, H. W., Parker, P. D., & Hu, X. (2024). Cross-Cultural Patterns of Gender Differences in STEM: Gender Stratification, Gender Equality and Gender-Equality Paradoxes. Educational Psychology Review, 36(2), 37. https://doi.org/10.1007/s10648-024-09872-3
Hair, J. (2009). Multivariate Data Analysis. Faculty Articles.
Hargittai, E., & Shafer, S. (2006). Differences in Actual and Perceived Online Skills: The Role of Gender. Social Science Quarterly, 87(2), 432–448. https://doi.org/10.1111/j.1540-6237.2006.00389.x
Hatlevik, O. E., Gumundsdóttir, G. B., & Loi, M. (2015). Digital diversity among upper secondary students: A multilevel analysis of the relationship between cultural capital, self-efficacy, strategic use of information and digital competence. Computers & Education, 81, 345–353. https://doi.org/10.1016/j.compedu.2014.10.019
Hatlevik, O. E., Throndsen, I., Loi, M., & Gudmundsdottir, G. B. (2018). Students’ ICT self-efficacy and computer and information literacy: Determinants and relationships. Computers & Education, 118, 107–119. https://doi.org/10.1016/j.compedu.2017.11.011
Hori, R., & Fujii, M. (2021). Impact of Using ICT for Learning Purposes on Self-Efficacy and Persistence: Evidence from Pisa 2018. Sustainability, 13(11), 6463. https://doi.org/10.3390/su13116463
Hristov, M., Yada, T., Fagerlund, J., Näykki, P., & Häkkinen, P. (2026). Understanding the relationships among ICT use, self-efficacy, and achievement in PISA 2022: A multigroup analysis featuring gender and immigrant status. Computers & Education, 244, 105539. https://doi.org/10.1016/j.compedu.2025.105539
Hsu, M.-H., & Chiu, C.-M. (2004). Internet self-efficacy and electronic service acceptance. Decision Support Systems, 38(3), 369–381. https://doi.org/10.1016/j.dss.2003.08.001
Jagtap, S. (2024). A No Code Website Builder Approach. INTERANTIONAL JOURNAL OF SCIENTIFIC RESEARCH IN ENGINEERING AND MANAGEMENT, 08(04), 1–5. https://doi.org/10.55041/IJSREM32185
Jorgensen, T. D., Pornprasertmanit, S., Schoemann, A. M., Rosseel, Y., Miller, P., Quick, C., Garnier-Villarreal, M., Selig, J., Boulton, A., Preacher, K., Coffman, D., Rhemtulla, M., Robitzsch, A., Enders, C., Arslan, R., Clinton, B., Panko, P., Merkle, E., Chesnut, S., … Vanbrabant, L. (2025). semTools: Useful Tools for Structural Equation Modeling.
Karpiński, Z., Di Pietro, G., & Biagi, F. (2023). Non-cognitive skills and social gaps in digital skills: Evidence from ICILS 2018. Learning and Individual Differences, 102, None. https://doi.org/10.1016/j.lindif.2022.102254
Kennedy, A. I., Strello, A., & Strietholt, R. (2025). Relationships Between Computer and Information Literacy, Computational Thinking, and Student Background. In J. Fraillon (Ed.), An International Perspective on Digital Literacy: Results from ICILS 2023 (pp. 119–138). Springer Nature Switzerland. https://doi.org/10.1007/978-3-031-87722-3_6
Kunina-Habenicht, O., & Goldhammer, F. (2020). ICT Engagement: A new construct and its assessment in PISA 2015. Large-Scale Assessments in Education, 8(1), 6. https://doi.org/10.1186/s40536-020-00084-z
Leitgöb, H., Seddig, D., Asparouhov, T., Behr, D., Davidov, E., De Roover, K., Jak, S., Meitinger, K., Menold, N., Muthén, B., Rudnev, M., Schmidt, P., & van de Schoot, R. (2023). Measurement invariance in the social sciences: Historical development, methodological challenges, state of the art, and future perspectives. Social Science Research, 110, 102805. https://doi.org/10.1016/j.ssresearch.2022.102805
Liang, J.-C., & Tsai, C.-C. (2008). Internet self-efficacy and preferences toward constructivist Internet-based learning environments: A study of pre-school teachers in Taiwan. Educational Technology and Society, 11(1), 226–237.
Lively, J., Hutson, J., & Melick, E. (2023). Integrating AI-Generative Tools in Web Design Education: Enhancing Student Aesthetic and Creative Copy Capabilities Using Image and Text-Based AI Generators. DS Journal of Artificial Intelligence and Robotics, 1(1), 23–36. https://doi.org/10.59232/AIR-V1I1P103
Lythreatis, S., Singh, S. K., & El-Kassar, A.-N. (2022). The digital divide: A review and future research agenda. Technological Forecasting and Social Change, 175, 121359. https://doi.org/10.1016/j.techfore.2021.121359
Marsh, H. W., Parker, P. D., Guo, J., Basarkod, G., Niepel, C., & Van Zanden, B. (2021). Illusory gender-equality paradox, math self-concept, and frame-of-reference effects: New integrative explanations for multiple paradoxes. Journal of Personality and Social Psychology, 121(1), 168–183. https://doi.org/10.1037/pspp0000306
Martín-Párraga, L., Llorente-Cejudo, C., & Barroso-Osuna, J. (2023). Self-Perception of Digital Competence in University Lecturers: A Comparative Study between Universities in Spain and Peru According to the DigCompEdu Model. Societies, 13(6), 142. https://doi.org/10.3390/soc13060142
Milfont, T. L., & Fischer, R. (2010). Testing measurement invariance across groups: Applications in cross-cultural research. International Journal of Psychological Research, 3(1), 111–130. https://doi.org/10.21500/20112084.857
Moos, D. C., & Azevedo, R. (2009). Learning With Computer-Based Learning Environments: A Literature Review of Computer Self-Efficacy. Review of Educational Research, 79(2), 576–600. https://doi.org/10.3102/0034654308326083
OECD. (2019). PISA 2018 assessment and analytical framework. OECD Publishing. https://doi.org/10.1787/b25efab8-en
OECD. (2023). PISA 2022 ICT Framework. In PISA 2022 Assessment and Analytical Framework (pp. 238–285). OECD Publishing.
OECD. (2024). PISA 2022 Technical Report. OECD Publishing.
Papastergiou, M. (2010). Enhancing Physical Education and Sport Science students’ self-efficacy and attitudes regarding Information and Communication Technologies through a computer literacy course. Computers & Education, 54(1), 298–308. https://doi.org/10.1016/j.compedu.2009.08.015
Rohatgi, A., Hatlevik, O. E., & Scherer, R. (2016). The role of ICT self-efficacy for students’ ICT use and their achievement in a computer and information literacy test. Computers & Education, 102, 103–116. https://doi.org/http://dx.doi.org/10.1016/j.compedu.2016.08.001
Rosseel, Y. (2012). Lavaan: An R Package for Structural Equation Modeling. Journal of Statistical Software, 48, 1–36. https://doi.org/10.18637/jss.v048.i02
Rožman, M., Holtmann, M., & Meinck, S. (2025). Students’ Engagement with Information and Communications Technologies. In J. Fraillon (Ed.), An International Perspective on Digital Literacy: Results from ICILS 2023 (pp. 139–180). Springer Nature Switzerland. https://doi.org/10.1007/978-3-031-87722-3_7
Rutkowski, L., & Svetina, D. (2017). Measurement Invariance in International Surveys: Categorical Indicators and Fit Measure Performance. Applied Measurement in Education, 30(1), 39–51. https://doi.org/10.1080/08957347.2016.1243540
Scherer, R., & Siddiq, F. (2015). Revisiting teachers’ computer self-efficacy: A differentiated view on gender differences. Computers in Human Behavior, 53, 48–57. https://doi.org/10.1016/j.chb.2015.06.038
Steele, C. M., & Aronson, J. (1995). Stereotype threat and the intellectual test performance of African Americans. Journal of Personality and Social Psychology, 69(5), 797–811. https://doi.org/10.1037/0022-3514.69.5.797
Tømte, C., & Hatlevik, O. E. (2011). Gender-differences in Self-efficacy ICT related to various ICT-user profiles in Finland and Norway. How do self-efficacy, gender and ICT-user profiles relate to findings from PISA 2006. Computers & Education, 57(1), 1416–1424. https://doi.org/10.1016/j.compedu.2010.12.011
Ulfert-Blank, A.-S., & Schmidt, I. (2022). Assessing digital self-efficacy: Review and scale development. Computers & Education, 191, 104626. https://doi.org/10.1016/j.compedu.2022.104626
Wang, J., & Wang, X. (2012). Structural Equation Modeling: Applications Using Mplus. John Wiley & Sons, Ltd.
Weigel, F. K., & Hazen, B. T. (2014). Technical proficiency for IS Success. Computers in Human Behavior, 31, 27–36. https://doi.org/10.1016/j.chb.2013.10.014
What is PISA? (2023). In PISA 2022 Assessment and Analytical Framework. OECD Publishing. https://doi.org/10.1787/dfe0bf9c-en
Yu, H., & Hu, J. (2022). ICT Self-Efficacy and ICT Interest Mediate the Gender Differences in Digital Reading: A Multilevel Serial Mediation Analysis. International Journal of Emerging Technologies in Learning (iJET), 17(05), 211–225. https://doi.org/10.3991/ijet.v17i05.25691
8 Appendix
Analysis Stage | Suggested Modification | MI | EPC | Std. EPC |
|---|---|---|---|---|
First Re-specification | spec_dse =∼ source_info | 13,668.277 | -0.711 | -0.537 |
source_info ∼∼ visual_coding | 5,105.123 | -0.246 | -0.544 | |
source_info ∼∼ programming | 4,671.886 | -0.236 | -0.542 | |
search_info ∼∼ write_text | 4,544.120 | -0.226 | -0.526 | |
spec_dse =∼ insert_image | 4,529.092 | 0.582 | 0.440 | |
Second Re-specification | gen_dse =∼ develop_webpage | 4,707.518 | -0.400 | -0.306 |
programming ∼∼ visual_coding | 4,707.511 | -0.325 | -0.912 | |
spec_dse =∼ create_media | 3,982.957 | -0.375 | -0.286 | |
search_info ∼∼ write_text | 3,553.446 | -0.205 | -0.501 | |
spec_dse =∼ insert_image | 2,897.128 | 0.411 | 0.313 | |
Note. ∼∼ indicates residual correlation; =∼ indicates cross-loading. | ||||
Item Pair | Residual Corr. | Model Stage |
|---|---|---|
insert_image ∼∼ programming | -0.232 | First Re-specification |
source_info ∼∼ visual_coding | 0.204 | |
search_info ∼∼ visual_coding | -0.197 | |
source_info ∼∼ programming | 0.194 | |
search_info ∼∼ programming | -0.191 | |
insert_image ∼∼ visual_coding | -0.189 | |
install_app ∼∼ programming | -0.176 | |
write_text ∼∼ programming | -0.170 | |
write_text ∼∼ visual_coding | -0.159 | |
install_app ∼∼ visual_coding | -0.156 | |
create_media ∼∼ develop_webpage | 0.146 | |
search_info ∼∼ write_text | 0.145 | |
source_info ∼∼ insert_image | -0.143 | |
source_info ∼∼ develop_webpage | 0.136 | |
edit_image ∼∼ develop_webpage | 0.130 | |
search_info ∼∼ source_info | -0.129 | |
source_info ∼∼ install_app | -0.125 | |
source_info ∼∼ write_text | -0.123 | |
install_app ∼∼ develop_webpage | -0.114 | |
insert_image ∼∼ develop_webpage | -0.113 | |
change_settings ∼∼ develop_webpage | 0.110 | |
install_app ∼∼ insert_image | 0.109 | |
share_content ∼∼ programming | -0.106 | |
share_content ∼∼ visual_coding | -0.105 | |
insert_image ∼∼ programming | -0.194 | Second Re-specification |
create_media ∼∼ develop_webpage | 0.177 | |
search_info ∼∼ visual_coding | -0.161 | |
edit_image ∼∼ develop_webpage | 0.158 | |
search_info ∼∼ programming | -0.156 | |
insert_image ∼∼ visual_coding | -0.150 | |
install_app ∼∼ programming | -0.143 | |
change_settings ∼∼ develop_webpage | 0.142 | |
write_text ∼∼ programming | -0.134 | |
search_info ∼∼ write_text | 0.125 | |
write_text ∼∼ visual_coding | -0.123 | |
install_app ∼∼ visual_coding | -0.122 | |
install_app ∼∼ create_media | -0.103 | |
Note. Only pairs with residual correlations > 0.1 are shown. | ||
Country | Latent Factor | Item | Std. Loading | N | χ² |
|---|---|---|---|---|---|
Denmark | gen_dse | search_info | 0.781 | 3,038 | 4,497.77 |
evaluate_info | 0.660 | ||||
install_app | 0.702 | ||||
share_content | 0.710 | ||||
write_text | 0.790 | ||||
insert_image | 0.877 | ||||
edit_image | 0.504 | ||||
change_settings | 0.527 | ||||
spec_dse | develop_webpage | 0.717 | |||
programming | 0.842 | ||||
visual_coding | 0.868 | ||||
Korea | gen_dse | search_info | 0.856 | 3,723 | 3,502.52 |
evaluate_info | 0.730 | ||||
install_app | 0.799 | ||||
share_content | 0.843 | ||||
write_text | 0.888 | ||||
insert_image | 0.886 | ||||
edit_image | 0.766 | ||||
change_settings | 0.785 | ||||
spec_dse | develop_webpage | 0.804 | |||
programming | 0.756 | ||||
visual_coding | 0.801 | ||||
Spain | gen_dse | search_info | 0.728 | 11,799 | 3,398.34 |
evaluate_info | 0.565 | ||||
install_app | 0.680 | ||||
share_content | 0.712 | ||||
write_text | 0.770 | ||||
insert_image | 0.789 | ||||
edit_image | 0.584 | ||||
change_settings | 0.641 | ||||
spec_dse | develop_webpage | 0.714 | |||
programming | 0.773 | ||||
visual_coding | 0.776 | ||||
Finland | gen_dse | search_info | 0.828 | 4,249 | 3,273.07 |
evaluate_info | 0.752 | ||||
install_app | 0.761 | ||||
share_content | 0.718 | ||||
write_text | 0.825 | ||||
insert_image | 0.802 | ||||
edit_image | 0.660 | ||||
change_settings | 0.767 | ||||
spec_dse | develop_webpage | 0.763 | |||
programming | 0.869 | ||||
visual_coding | 0.880 | ||||
Czech Republic | gen_dse | search_info | 0.725 | 8,169 | 3,240.16 |
evaluate_info | 0.687 | ||||
install_app | 0.756 | ||||
share_content | 0.722 | ||||
write_text | 0.726 | ||||
insert_image | 0.826 | ||||
edit_image | 0.616 | ||||
change_settings | 0.678 | ||||
spec_dse | develop_webpage | 0.746 | |||
programming | 0.776 | ||||
visual_coding | 0.720 | ||||
Sweden | gen_dse | search_info | 0.846 | 3,401 | 2,685.66 |
evaluate_info | 0.764 | ||||
install_app | 0.727 | ||||
share_content | 0.715 | ||||
write_text | 0.845 | ||||
insert_image | 0.876 | ||||
edit_image | 0.625 | ||||
change_settings | 0.752 | ||||
spec_dse | develop_webpage | 0.717 | |||
programming | 0.797 | ||||
visual_coding | 0.803 | ||||
Malta | gen_dse | search_info | 0.859 | 3,115 | 2,349.60 |
evaluate_info | 0.747 | ||||
install_app | 0.846 | ||||
share_content | 0.857 | ||||
write_text | 0.876 | ||||
insert_image | 0.896 | ||||
edit_image | 0.607 | ||||
change_settings | 0.838 | ||||
spec_dse | develop_webpage | 0.825 | |||
programming | 0.822 | ||||
visual_coding | 0.816 | ||||
Kazakhstan | gen_dse | search_info | 0.737 | 4,852 | 2,334.44 |
evaluate_info | 0.686 | ||||
install_app | 0.720 | ||||
share_content | 0.771 | ||||
write_text | 0.752 | ||||
insert_image | 0.796 | ||||
edit_image | 0.671 | ||||
change_settings | 0.739 | ||||
spec_dse | develop_webpage | 0.736 | |||
programming | 0.786 | ||||
visual_coding | 0.699 | ||||
Germany | gen_dse | search_info | 0.698 | 7,791 | 2,173.40 |
evaluate_info | 0.575 | ||||
install_app | 0.687 | ||||
share_content | 0.637 | ||||
write_text | 0.685 | ||||
insert_image | 0.742 | ||||
edit_image | 0.608 | ||||
change_settings | 0.687 | ||||
spec_dse | develop_webpage | 0.735 | |||
programming | 0.858 | ||||
visual_coding | 0.823 | ||||
Austria | gen_dse | search_info | 0.666 | 3,448 | 1,998.81 |
evaluate_info | 0.555 | ||||
install_app | 0.672 | ||||
share_content | 0.652 | ||||
write_text | 0.695 | ||||
insert_image | 0.770 | ||||
edit_image | 0.566 | ||||
change_settings | 0.624 | ||||
spec_dse | develop_webpage | 0.728 | |||
programming | 0.867 | ||||
visual_coding | 0.845 | ||||
Slovak Republic | gen_dse | search_info | 0.779 | 3,034 | 1,929.53 |
evaluate_info | 0.685 | ||||
install_app | 0.762 | ||||
share_content | 0.711 | ||||
write_text | 0.767 | ||||
insert_image | 0.852 | ||||
edit_image | 0.618 | ||||
change_settings | 0.685 | ||||
spec_dse | develop_webpage | 0.755 | |||
programming | 0.793 | ||||
visual_coding | 0.768 | ||||
Latvia | gen_dse | search_info | 0.770 | 2,705 | 1,915.60 |
evaluate_info | 0.686 | ||||
install_app | 0.795 | ||||
share_content | 0.769 | ||||
write_text | 0.738 | ||||
insert_image | 0.822 | ||||
edit_image | 0.623 | ||||
change_settings | 0.745 | ||||
spec_dse | develop_webpage | 0.776 | |||
programming | 0.749 | ||||
visual_coding | 0.715 | ||||
Belgium | gen_dse | search_info | 0.709 | 3,365 | 1,846.51 |
evaluate_info | 0.636 | ||||
install_app | 0.676 | ||||
share_content | 0.689 | ||||
write_text | 0.725 | ||||
insert_image | 0.800 | ||||
edit_image | 0.590 | ||||
change_settings | 0.667 | ||||
spec_dse | develop_webpage | 0.683 | |||
programming | 0.751 | ||||
visual_coding | 0.722 | ||||
Greece | gen_dse | search_info | 0.795 | 3,576 | 1,707.90 |
evaluate_info | 0.684 | ||||
install_app | 0.763 | ||||
share_content | 0.729 | ||||
write_text | 0.758 | ||||
insert_image | 0.723 | ||||
edit_image | 0.701 | ||||
change_settings | 0.716 | ||||
spec_dse | develop_webpage | 0.758 | |||
programming | 0.815 | ||||
visual_coding | 0.784 | ||||
Slovenia | gen_dse | search_info | 0.808 | 3,318 | 1,672.83 |
evaluate_info | 0.736 | ||||
install_app | 0.762 | ||||
share_content | 0.779 | ||||
write_text | 0.814 | ||||
insert_image | 0.851 | ||||
edit_image | 0.710 | ||||
change_settings | 0.767 | ||||
spec_dse | develop_webpage | 0.757 | |||
programming | 0.862 | ||||
visual_coding | 0.866 | ||||
Chile | gen_dse | search_info | 0.794 | 3,216 | 1,496.57 |
evaluate_info | 0.743 | ||||
install_app | 0.757 | ||||
share_content | 0.788 | ||||
write_text | 0.838 | ||||
insert_image | 0.854 | ||||
edit_image | 0.669 | ||||
change_settings | 0.730 | ||||
spec_dse | develop_webpage | 0.730 | |||
programming | 0.882 | ||||
visual_coding | 0.870 | ||||
Italy | gen_dse | search_info | 0.639 | 3,376 | 1,420.18 |
evaluate_info | 0.604 | ||||
install_app | 0.658 | ||||
share_content | 0.644 | ||||
write_text | 0.653 | ||||
insert_image | 0.721 | ||||
edit_image | 0.564 | ||||
change_settings | 0.650 | ||||
spec_dse | develop_webpage | 0.680 | |||
programming | 0.790 | ||||
visual_coding | 0.795 | ||||
Hungary | gen_dse | search_info | 0.711 | 3,491 | 1,416.46 |
evaluate_info | 0.633 | ||||
install_app | 0.744 | ||||
share_content | 0.694 | ||||
write_text | 0.738 | ||||
insert_image | 0.830 | ||||
edit_image | 0.639 | ||||
change_settings | 0.664 | ||||
spec_dse | develop_webpage | 0.752 | |||
programming | 0.807 | ||||
visual_coding | 0.795 | ||||
United States | gen_dse | search_info | 0.824 | 2,352 | 1,325.38 |
evaluate_info | 0.753 | ||||
install_app | 0.701 | ||||
share_content | 0.839 | ||||
write_text | 0.836 | ||||
insert_image | 0.906 | ||||
edit_image | 0.562 | ||||
change_settings | 0.819 | ||||
spec_dse | develop_webpage | 0.703 | |||
programming | 0.838 | ||||
visual_coding | 0.797 | ||||
Romania | gen_dse | search_info | 0.822 | 3,270 | 1,322.98 |
evaluate_info | 0.757 | ||||
install_app | 0.806 | ||||
share_content | 0.837 | ||||
write_text | 0.816 | ||||
insert_image | 0.838 | ||||
edit_image | 0.670 | ||||
change_settings | 0.773 | ||||
spec_dse | develop_webpage | 0.787 | |||
programming | 0.852 | ||||
visual_coding | 0.827 | ||||
Croatia | gen_dse | search_info | 0.905 | 2,911 | 1,178.08 |
evaluate_info | 0.835 | ||||
install_app | 0.881 | ||||
share_content | 0.869 | ||||
write_text | 0.905 | ||||
insert_image | 0.934 | ||||
edit_image | 0.798 | ||||
change_settings | 0.852 | ||||
spec_dse | develop_webpage | 0.809 | |||
programming | 0.879 | ||||
visual_coding | 0.808 | ||||
Uruguay | gen_dse | search_info | 0.719 | 2,933 | 1,129.03 |
evaluate_info | 0.624 | ||||
install_app | 0.681 | ||||
share_content | 0.738 | ||||
write_text | 0.787 | ||||
insert_image | 0.780 | ||||
edit_image | 0.579 | ||||
change_settings | 0.600 | ||||
spec_dse | develop_webpage | 0.652 | |||
programming | 0.751 | ||||
visual_coding | 0.747 |
Country | N | General DSE Correlation | Specialized DSE Correlation |
|---|---|---|---|
Overall | 85,055 | 0.956 | 0.979 |
Austria | 3,335 | 0.968 | 0.985 |
Belgium | 3,208 | 0.976 | 0.979 |
Chile | 2,781 | 0.962 | 0.981 |
Czech Republic | 8,047 | 0.971 | 0.977 |
Germany | 6,638 | 0.958 | 0.985 |
Denmark | 2,851 | 0.964 | 0.987 |
Spain | 10,925 | 0.968 | 0.980 |
Finland | 4,026 | 0.977 | 0.988 |
Greece | 3,426 | 0.948 | 0.985 |
Croatia | 2,690 | 0.942 | 0.984 |
Hungary | 3,427 | 0.965 | 0.990 |
Italy | 3,311 | 0.964 | 0.981 |
Kazakhstan | 4,700 | 0.970 | 0.953 |
Korea | 3,661 | 0.979 | 0.969 |
Latvia | 2,605 | 0.973 | 0.975 |
Malta | 2,803 | 0.954 | 0.984 |
Romania | 2,978 | 0.964 | 0.984 |
Slovak Republic | 2,992 | 0.965 | 0.983 |
Slovenia | 3,163 | 0.966 | 0.986 |
Sweden | 2,945 | 0.963 | 0.983 |
Uruguay | 2,627 | 0.958 | 0.976 |
United States | 1,916 | 0.969 | 0.986 |
Analysis Stage | Suggested Modification | MI | EPC | Std. EPC |
|---|---|---|---|---|
First Re-specification | gen_dse =∼ identify_app | 76,502.416 | -1.080 | -0.949 |
gen_dse =∼ programming | 22,811.884 | 0.590 | 0.519 | |
gen_dse =∼ identify_error | 20,756.782 | 0.565 | 0.497 | |
privacy_settings ∼∼ identify_app | 20,732.039 | -0.281 | -1.518 | |
gen_dse =∼ logical_solution | 18,787.077 | 0.530 | 0.466 | |
Second Re-specification | gen_dse =∼ develop_webpage | 39,013.994 | -0.564 | -0.498 |
create_media ∼∼ develop_webpage | 11,471.324 | -0.264 | -0.859 | |
search_info ∼∼ evaluate_info | 8,812.369 | -0.165 | -0.711 | |
privacy_settings ∼∼ develop_webpage | 8,424.594 | -0.239 | -0.738 | |
spec_dse =∼ search_info | 7,859.758 | 0.390 | 0.322 | |
Note. ∼∼ indicates correlation; =∼ indicates cross-loading. | ||||
Item Pair | Residual Corr. | Model Stage |
|---|---|---|
search_info ∼∼ programming | -0.343 | First Re-specification |
search_info ∼∼ logical_solution | -0.289 | |
identify_app ∼∼ logical_solution | -0.284 | |
identify_error ∼∼ identify_app | -0.280 | |
search_info ∼∼ identify_error | -0.279 | |
programming ∼∼ identify_app | -0.269 | |
share_content ∼∼ programming | -0.245 | |
share_content ∼∼ identify_error | -0.218 | |
privacy_settings ∼∼ identify_app | 0.217 | |
pair_collab ∼∼ programming | -0.214 | |
share_content ∼∼ logical_solution | -0.210 | |
write_text ∼∼ programming | -0.205 | |
pair_collab ∼∼ identify_error | -0.204 | |
write_text ∼∼ identify_error | -0.189 | |
create_media ∼∼ develop_webpage | 0.185 | |
pair_collab ∼∼ logical_solution | -0.183 | |
evaluate_info ∼∼ programming | -0.180 | |
write_text ∼∼ logical_solution | -0.168 | |
collect_data ∼∼ develop_webpage | 0.155 | |
privacy_settings ∼∼ develop_webpage | 0.152 | |
develop_webpage ∼∼ identify_app | -0.144 | |
evaluate_info ∼∼ logical_solution | -0.141 | |
evaluate_info ∼∼ identify_error | -0.140 | |
explain_content ∼∼ programming | -0.137 | |
create_media ∼∼ identify_app | 0.132 | |
collect_data ∼∼ identify_app | 0.121 | |
explain_content ∼∼ identify_error | -0.118 | |
explain_content ∼∼ logical_solution | -0.113 | |
programming ∼∼ logical_solution | 0.103 | |
programming ∼∼ identify_error | 0.101 | |
search_info ∼∼ programming | -0.281 | Second Re-specification |
create_media ∼∼ develop_webpage | 0.233 | |
search_info ∼∼ logical_solution | -0.221 | |
privacy_settings ∼∼ develop_webpage | 0.214 | |
search_info ∼∼ identify_error | -0.209 | |
collect_data ∼∼ develop_webpage | 0.201 | |
share_content ∼∼ programming | -0.184 | |
pair_collab ∼∼ programming | -0.156 | |
develop_webpage ∼∼ logical_solution | -0.153 | |
share_content ∼∼ identify_error | -0.148 | |
write_text ∼∼ programming | -0.144 | |
share_content ∼∼ logical_solution | -0.142 | |
develop_webpage ∼∼ identify_error | -0.139 | |
pair_collab ∼∼ identify_error | -0.138 | |
write_text ∼∼ identify_error | -0.120 | |
evaluate_info ∼∼ programming | -0.120 | |
pair_collab ∼∼ logical_solution | -0.119 | |
explain_content ∼∼ develop_webpage | 0.104 | |
write_text ∼∼ logical_solution | -0.100 | |
Note. Only pairs with residual correlations > 0.1 are shown. | ||
Country | Latent Factor | Item | Std. Loading | N | χ² |
|---|---|---|---|---|---|
Spain | gen_dse | search_info | 0.854 | 30,800 | 29,261.20 |
evaluate_info | 0.803 | ||||
collect_data | 0.762 | ||||
explain_content | 0.823 | ||||
share_content | 0.838 | ||||
pair_collab | 0.805 | ||||
write_text | 0.834 | ||||
create_media | 0.800 | ||||
privacy_settings | 0.746 | ||||
spec_dse | programming | 0.788 | |||
develop_webpage | 0.756 | ||||
identify_error | 0.882 | ||||
identify_app | 0.914 | ||||
logical_solution | 0.833 | ||||
Czech Republic | gen_dse | search_info | 0.844 | 8,460 | 16,417.34 |
evaluate_info | 0.822 | ||||
collect_data | 0.752 | ||||
explain_content | 0.796 | ||||
share_content | 0.818 | ||||
pair_collab | 0.764 | ||||
write_text | 0.812 | ||||
create_media | 0.773 | ||||
privacy_settings | 0.776 | ||||
spec_dse | programming | 0.818 | |||
develop_webpage | 0.781 | ||||
identify_error | 0.900 | ||||
identify_app | 0.900 | ||||
logical_solution | 0.875 | ||||
Finland | gen_dse | search_info | 0.877 | 10,239 | 15,134.78 |
evaluate_info | 0.902 | ||||
collect_data | 0.842 | ||||
explain_content | 0.890 | ||||
share_content | 0.887 | ||||
pair_collab | 0.886 | ||||
write_text | 0.901 | ||||
create_media | 0.845 | ||||
privacy_settings | 0.869 | ||||
spec_dse | programming | 0.779 | |||
develop_webpage | 0.795 | ||||
identify_error | 0.875 | ||||
identify_app | 1.012 | ||||
logical_solution | 0.856 | ||||
Italy | gen_dse | search_info | 0.859 | 10,552 | 14,876.06 |
evaluate_info | 0.827 | ||||
collect_data | 0.724 | ||||
explain_content | 0.806 | ||||
share_content | 0.841 | ||||
pair_collab | 0.797 | ||||
write_text | 0.810 | ||||
create_media | 0.782 | ||||
privacy_settings | 0.745 | ||||
spec_dse | programming | 0.761 | |||
develop_webpage | 0.708 | ||||
identify_error | 0.845 | ||||
identify_app | 0.952 | ||||
logical_solution | 0.784 | ||||
Austria | gen_dse | search_info | 0.868 | 6,151 | 14,565.84 |
evaluate_info | 0.843 | ||||
collect_data | 0.744 | ||||
explain_content | 0.836 | ||||
share_content | 0.868 | ||||
pair_collab | 0.824 | ||||
write_text | 0.820 | ||||
create_media | 0.778 | ||||
privacy_settings | 0.807 | ||||
spec_dse | programming | 0.795 | |||
develop_webpage | 0.727 | ||||
identify_error | 0.881 | ||||
identify_app | 0.969 | ||||
logical_solution | 0.848 | ||||
Kazakhstan | gen_dse | search_info | 0.906 | 19,769 | 13,978.45 |
evaluate_info | 0.911 | ||||
collect_data | 0.880 | ||||
explain_content | 0.904 | ||||
share_content | 0.910 | ||||
pair_collab | 0.904 | ||||
write_text | 0.891 | ||||
create_media | 0.879 | ||||
privacy_settings | 0.889 | ||||
spec_dse | programming | 0.831 | |||
develop_webpage | 0.896 | ||||
identify_error | 0.892 | ||||
identify_app | 0.914 | ||||
logical_solution | 0.882 | ||||
Hungary | gen_dse | search_info | 0.895 | 6,198 | 12,627.22 |
evaluate_info | 0.855 | ||||
collect_data | 0.849 | ||||
explain_content | 0.867 | ||||
share_content | 0.891 | ||||
pair_collab | 0.853 | ||||
write_text | 0.869 | ||||
create_media | 0.806 | ||||
privacy_settings | 0.829 | ||||
spec_dse | programming | 0.800 | |||
develop_webpage | 0.768 | ||||
identify_error | 0.895 | ||||
identify_app | 0.990 | ||||
logical_solution | 0.866 | ||||
Slovenia | gen_dse | search_info | 0.852 | 6,721 | 12,495.84 |
evaluate_info | 0.841 | ||||
collect_data | 0.738 | ||||
explain_content | 0.840 | ||||
share_content | 0.853 | ||||
pair_collab | 0.815 | ||||
write_text | 0.789 | ||||
create_media | 0.780 | ||||
privacy_settings | 0.822 | ||||
spec_dse | programming | 0.774 | |||
develop_webpage | 0.803 | ||||
identify_error | 0.878 | ||||
identify_app | 0.937 | ||||
logical_solution | 0.856 | ||||
Belgium | gen_dse | search_info | 0.865 | 8,286 | 11,511.71 |
evaluate_info | 0.836 | ||||
collect_data | 0.789 | ||||
explain_content | 0.834 | ||||
share_content | 0.843 | ||||
pair_collab | 0.804 | ||||
write_text | 0.832 | ||||
create_media | 0.796 | ||||
privacy_settings | 0.791 | ||||
spec_dse | programming | 0.786 | |||
develop_webpage | 0.757 | ||||
identify_error | 0.880 | ||||
identify_app | 0.921 | ||||
logical_solution | 0.865 | ||||
Korea | gen_dse | search_info | 0.948 | 6,454 | 11,003.93 |
evaluate_info | 0.920 | ||||
collect_data | 0.885 | ||||
explain_content | 0.906 | ||||
share_content | 0.945 | ||||
pair_collab | 0.929 | ||||
write_text | 0.904 | ||||
create_media | 0.876 | ||||
privacy_settings | 0.893 | ||||
spec_dse | programming | 0.862 | |||
develop_webpage | 0.884 | ||||
identify_error | 0.943 | ||||
identify_app | 0.959 | ||||
logical_solution | 0.925 | ||||
Croatia | gen_dse | search_info | 0.872 | 6,135 | 10,918.98 |
evaluate_info | 0.873 | ||||
collect_data | 0.828 | ||||
explain_content | 0.876 | ||||
share_content | 0.895 | ||||
pair_collab | 0.862 | ||||
write_text | 0.872 | ||||
create_media | 0.847 | ||||
privacy_settings | 0.827 | ||||
spec_dse | programming | 0.820 | |||
develop_webpage | 0.809 | ||||
identify_error | 0.894 | ||||
identify_app | 0.891 | ||||
logical_solution | 0.872 | ||||
Sweden | gen_dse | search_info | 0.927 | 6,072 | 10,827.52 |
evaluate_info | 0.909 | ||||
collect_data | 0.820 | ||||
explain_content | 0.882 | ||||
share_content | 0.899 | ||||
pair_collab | 0.866 | ||||
write_text | 0.893 | ||||
create_media | 0.813 | ||||
privacy_settings | 0.841 | ||||
spec_dse | programming | 0.756 | |||
develop_webpage | 0.791 | ||||
identify_error | 0.867 | ||||
identify_app | 0.967 | ||||
logical_solution | 0.839 | ||||
Germany | gen_dse | search_info | 0.897 | 6,116 | 10,763.14 |
evaluate_info | 0.831 | ||||
collect_data | 0.764 | ||||
explain_content | 0.831 | ||||
share_content | 0.862 | ||||
pair_collab | 0.801 | ||||
write_text | 0.800 | ||||
create_media | 0.758 | ||||
privacy_settings | 0.795 | ||||
spec_dse | programming | 0.780 | |||
develop_webpage | 0.734 | ||||
identify_error | 0.872 | ||||
identify_app | 0.926 | ||||
logical_solution | 0.850 | ||||
Slovak Republic | gen_dse | search_info | 0.860 | 5,824 | 10,218.70 |
evaluate_info | 0.858 | ||||
collect_data | 0.803 | ||||
explain_content | 0.841 | ||||
share_content | 0.876 | ||||
pair_collab | 0.849 | ||||
write_text | 0.854 | ||||
create_media | 0.804 | ||||
privacy_settings | 0.815 | ||||
spec_dse | programming | 0.783 | |||
develop_webpage | 0.794 | ||||
identify_error | 0.869 | ||||
identify_app | 0.942 | ||||
logical_solution | 0.848 | ||||
Denmark | gen_dse | search_info | 0.899 | 6,200 | 9,991.38 |
evaluate_info | 0.865 | ||||
collect_data | 0.746 | ||||
explain_content | 0.842 | ||||
share_content | 0.890 | ||||
pair_collab | 0.846 | ||||
write_text | 0.838 | ||||
create_media | 0.791 | ||||
privacy_settings | 0.758 | ||||
spec_dse | programming | 0.753 | |||
develop_webpage | 0.763 | ||||
identify_error | 0.859 | ||||
identify_app | 0.939 | ||||
logical_solution | 0.829 | ||||
Romania | gen_dse | search_info | 0.854 | 7,364 | 9,664.89 |
evaluate_info | 0.851 | ||||
collect_data | 0.815 | ||||
explain_content | 0.852 | ||||
share_content | 0.860 | ||||
pair_collab | 0.835 | ||||
write_text | 0.852 | ||||
create_media | 0.818 | ||||
privacy_settings | 0.810 | ||||
spec_dse | programming | 0.786 | |||
develop_webpage | 0.831 | ||||
identify_error | 0.857 | ||||
identify_app | 0.882 | ||||
logical_solution | 0.823 | ||||
Greece | gen_dse | search_info | 0.815 | 6,403 | 9,646.61 |
evaluate_info | 0.827 | ||||
collect_data | 0.783 | ||||
explain_content | 0.830 | ||||
share_content | 0.821 | ||||
pair_collab | 0.797 | ||||
write_text | 0.829 | ||||
create_media | 0.790 | ||||
privacy_settings | 0.792 | ||||
spec_dse | programming | 0.780 | |||
develop_webpage | 0.780 | ||||
identify_error | 0.830 | ||||
identify_app | 0.893 | ||||
logical_solution | 0.816 | ||||
Chile | gen_dse | search_info | 0.883 | 6,488 | 8,044.65 |
evaluate_info | 0.868 | ||||
collect_data | 0.784 | ||||
explain_content | 0.841 | ||||
share_content | 0.858 | ||||
pair_collab | 0.840 | ||||
write_text | 0.853 | ||||
create_media | 0.820 | ||||
privacy_settings | 0.811 | ||||
spec_dse | programming | 0.835 | |||
develop_webpage | 0.793 | ||||
identify_error | 0.894 | ||||
identify_app | 0.959 | ||||
logical_solution | 0.869 | ||||
Latvia | gen_dse | search_info | 0.863 | 5,373 | 7,699.77 |
evaluate_info | 0.833 | ||||
collect_data | 0.748 | ||||
explain_content | 0.819 | ||||
share_content | 0.851 | ||||
pair_collab | 0.810 | ||||
write_text | 0.811 | ||||
create_media | 0.772 | ||||
privacy_settings | 0.794 | ||||
spec_dse | programming | 0.752 | |||
develop_webpage | 0.746 | ||||
identify_error | 0.853 | ||||
identify_app | 0.919 | ||||
logical_solution | 0.817 | ||||
Uruguay | gen_dse | search_info | 0.886 | 6,618 | 6,957.39 |
evaluate_info | 0.885 | ||||
collect_data | 0.831 | ||||
explain_content | 0.867 | ||||
share_content | 0.884 | ||||
pair_collab | 0.857 | ||||
write_text | 0.877 | ||||
create_media | 0.863 | ||||
privacy_settings | 0.842 | ||||
spec_dse | programming | 0.839 | |||
develop_webpage | 0.832 | ||||
identify_error | 0.872 | ||||
identify_app | 0.959 | ||||
logical_solution | 0.852 | ||||
United States | gen_dse | search_info | 0.897 | 4,552 | 6,937.98 |
evaluate_info | 0.879 | ||||
collect_data | 0.813 | ||||
explain_content | 0.870 | ||||
share_content | 0.871 | ||||
pair_collab | 0.852 | ||||
write_text | 0.860 | ||||
create_media | 0.820 | ||||
privacy_settings | 0.813 | ||||
spec_dse | programming | 0.847 | |||
develop_webpage | 0.803 | ||||
identify_error | 0.897 | ||||
identify_app | 0.935 | ||||
logical_solution | 0.841 | ||||
Malta | gen_dse | search_info | 0.900 | 3,127 | 4,987.66 |
evaluate_info | 0.892 | ||||
collect_data | 0.819 | ||||
explain_content | 0.869 | ||||
share_content | 0.865 | ||||
pair_collab | 0.830 | ||||
write_text | 0.877 | ||||
create_media | 0.849 | ||||
privacy_settings | 0.863 | ||||
spec_dse | programming | 0.777 | |||
develop_webpage | 0.787 | ||||
identify_error | 0.886 | ||||
identify_app | 0.970 | ||||
logical_solution | 0.857 |
Country | N | General DSE Correlation | Specialized DSE Correlation |
|---|---|---|---|
Overall | 152,153 | 0.959 | 0.982 |
Austria | 5,123 | 0.965 | 0.991 |
Belgium | 6,188 | 0.957 | 0.987 |
Chile | 4,464 | 0.961 | 0.986 |
Czech Republic | 7,064 | 0.969 | 0.990 |
Germany | 4,340 | 0.959 | 0.988 |
Denmark | 4,420 | 0.951 | 0.989 |
Spain | 26,560 | 0.954 | 0.985 |
Finland | 7,733 | 0.965 | 0.978 |
Greece | 5,553 | 0.967 | 0.980 |
Croatia | 5,424 | 0.968 | 0.987 |
Hungary | 5,247 | 0.964 | 0.988 |
Italy | 9,182 | 0.964 | 0.986 |
Kazakhstan | 18,320 | 0.964 | 0.967 |
Korea | 5,986 | 0.953 | 0.991 |
Latvia | 4,714 | 0.959 | 0.983 |
Malta | 2,433 | 0.958 | 0.979 |
Romania | 6,400 | 0.966 | 0.982 |
Slovak Republic | 4,907 | 0.967 | 0.984 |
Slovenia | 5,815 | 0.971 | 0.984 |
Sweden | 4,808 | 0.963 | 0.975 |
Uruguay | 3,698 | 0.961 | 0.984 |
United States | 3,774 | 0.948 | 0.986 |
Footnotes
In PISA, Senate Weights are constructed by the OECD based on the final weight of the student, ensuring that each country totals 5000. For ICILS, we follow the same procedure based on total weights (TOTWGTS).↩︎
Research Assistant on NUDOS. Bsc (c) Sociology, Sociology Department, University of Chile. ismael.aguayo@ug.uchile.cl↩︎
Research Assistant on NUDOS. Msc (c) Political Science, Faculty of Government, University of Chile. nicolas.tobar@ug.uchile.cl.↩︎
Research Assistant on NUDOS. Msc (c) Social Sciences, Sociology Department, University of Chile. tomas.urzua@ug.uchile.cl↩︎
In PISA, Senate Weights are constructed by the OECD based on the final weight of the student, ensuring that each country totals 5000. For ICILS, we follow the same procedure based on total weights (TOTWGTS).↩︎